Velocity Benchmarks: What 10x Product Teams Track Weekly
Velocity benchmarks serve as a critical competitive differentiator in modern software development. Organizations that effectively implement velocity benchmarks gain significant market advantages over slower competitors.
The concept of “10x” teams often conjures images of superhuman developers. The reality, however, reveals that exceptional performance stems from well-designed velocity benchmark systems and development velocity tracking mechanisms.
Why is measuring the right velocity benchmarks crucial for scaling engineering teams?
The following key factors demonstrate why proper measurement systems matter for growth-oriented organizations. Each element contributes to sustainable scaling and performance improvement in technical teams.
- Provides objective data for decision-making and resource allocation
- Creates accountability and visibility into delivery performance
- Enables early identification of process bottlenecks and inefficiencies
- Facilitates meaningful team-to-team comparisons and best practice sharing
The cost of not tracking velocity benchmarks can be high.
Organizations that neglect velocity tracking face several significant disadvantages. These consequences directly impact both business outcomes and team health.
- Missed deadlines and unpredictable delivery schedules
- Competitive disadvantages as faster rivals capture market opportunities
- Team burnout from unsustainable work patterns and crisis management
- Inability to measure the impact of process improvements or investments
The Evolution of Velocity Metrics
The history of velocity benchmarks reflects the maturing understanding of software delivery performance. Effective velocity tracking has evolved significantly over the past decades as organizations seek more meaningful measurements.
Key Developments in Velocity Benchmarks Evolution
The measurement of software delivery performance has transformed dramatically over the decades. This evolution reflects growing understanding of what truly drives value in development organizations.
- 1970s-1980s: Rudimentary measurements like lines of code dominated productivity assessment
- 1990s-2000s: Function points and story points introduced more nuanced effort estimation
- 2000s-2010s: Agile methodologies shifted focus to iteration-based velocity metrics
- 2010s-Present: DevOps movement introduced DORA metrics and whole-system performance tracking
- Current frontier: Value stream-oriented velocity benchmarks connecting technical delivery to business outcomes
Forward-thinking organizations like Spotify revolutionized velocity approaches by implementing squad-based delivery models with dedicated metrics.
This evolution demonstrates how measuring team performance rather than individual output creates sustainable acceleration.
Modern velocity benchmarks now emphasize delivering customer value rather than tracking raw output volumes.
The Weekly Metrics Dashboard of Elite Product Teams
Elite product teams monitor specific velocity benchmarks weekly to maintain optimal performance. These carefully selected product team metrics provide actionable insights into delivery effectiveness.
Teams using these velocity benchmarks consistently outperform competitors across multiple dimensions of software delivery.
Let’s explore the essential development velocity tracking metrics that high-performing teams monitor weekly to maintain their competitive edge.
1. Deployment Frequency
Deployment frequency, a fundamental velocity benchmark, measures how often teams successfully release code to production. This velocity benchmark metric directly correlates with organizational agility and market responsiveness. Elite teams prioritize this development velocity tracking indicator as a primary measure of delivery pipeline health.
The following table presents industry velocity benchmarks for deployment frequency across various organization sizes and product team metrics. This table provides standardized benchmarks based on organization size to help teams assess their current performance. These values represent findings from the 2023 State of DevOps Report and industry research across multiple sectors.
| Organization Size | Low Performers | Medium Performers | High Performers | Elite Performers |
| Small (<100 employees) | Monthly | Bi-weekly | 2-3 times per week | Multiple times daily |
| Medium (100-1000) | Monthly | Weekly | Daily | Multiple times daily |
| Enterprise (1000+) | Quarterly | Monthly | Weekly | Daily or better |
Monzo, a mid-size FinTech company, increased their deployment frequency by 300% by implementing automated testing pipelines and feature flags. Their infrastructure improvements enabled smaller, safer releases that reduced deployment risk. This transformation required investments in CI/CD pipelines, automated testing, and team training on trunk-based development practices.
2. Lead Time for Changes
Lead time measures the duration between code commit and successful deployment to production. This critical velocity benchmark reveals how quickly organizations can respond to market opportunities or customer needs. Shorter lead times indicate more efficient delivery pipelines and greater organizational agility.
The ideal velocity benchmarks for lead time vary based on team size and industry, with product team metrics showing significant variation across sectors. These benchmarks reflect industry-specific complexities and regulatory environments. Organizations should compare their performance against peers within their specific vertical rather than generic standards.
| Industry | Team Size | Low Performers | Medium Performers | High Performers | Elite Performers |
| FinTech | Small | 1+ month | 1-2 weeks | 1-3 days | < 24 hours |
| FinTech | Medium/Large | 3+ months | 2-4 weeks | 3-7 days | < 48 hours |
| E-commerce | Small | 2+ weeks | 1 week | 1-2 days | < 12 hours |
| E-commerce | Medium/Large | 1+ month | 1-2 weeks | 2-4 days | < 24 hours |
| Healthcare | Any | 3+ months | 1-2 months | 1-2 weeks | 3-5 days |
Wayfair, an E-commerce leader, reduced its lead time from weeks to hours by implementing trunk-based development and automated testing. Their transformation focused on breaking down monolithic processes into smaller, independent workflows. This change enabled them to respond more rapidly to market trends and customer feedback.
3. Change Failure Rate
Change failure rate, a critical velocity benchmark, measures the percentage of deployments that result in degraded service requiring remediation.
This velocity benchmark metric balances speed with quality, ensuring that acceleration doesn’t compromise stability. Elite teams maintain low failure rates while simultaneously increasing deployment frequency.
Industry velocity benchmarks for change failure rate from the 2021 State of DevOps report reveal important product team metrics.
These failure rate benchmarks highlight the relationship between deployment frequency and quality. The data demonstrates that elite teams maintain both high deployment frequency and low failure rates simultaneously.
| Performance Level | Change Failure Rate |
| Low Performers | 46-60% |
| Medium Performers | 30-45% |
| High Performers | 16-30% |
| Elite Performers | 0-15% |
Research shows organizations using comprehensive automated testing maintain significantly lower failure rates. Teams implementing canary deployments and feature flags reduce the production impact of failed changes.
The correlation between testing coverage and failure rate demonstrates why quality gates remain essential for sustainable velocity.
4. Mean Time to Recovery (MTTR)
MTTR, an essential velocity benchmark, measures how quickly teams can restore service after a production incident. This development velocity tracking metric reveals organizational resilience and operational excellence.
Elite teams prioritize rapid recovery capabilities alongside prevention measures in their velocity benchmarks framework.
Velocity benchmarks data across technology stacks show significant MTTR variations in product team metrics. Recovery time benchmarks vary significantly based on architectural patterns.
These differences highlight how system design choices directly impact operational resilience and incident response capabilities.
| Tech Stack | Low Performers | Medium Performers | High Performers | Elite Performers |
| Monolithic | 1+ week | 1-3 days | 4-12 hours | < 1 hour |
| Microservices | 3+ days | 12-24 hours | 2-4 hours | < 30 minutes |
| Serverless | 2+ days | 6-12 hours | 1-2 hours | < 15 minutes |
Oscar Health reduced its MTTR from days to minutes by implementing automated rollbacks and enhanced monitoring. Their incident response automation included instant alerts, predefined remediation playbooks, and one-click rollbacks.
These improvements significantly reduced customer impact during incidents while maintaining team confidence during deployments.
5. Technical Debt Accumulation Rate
The technical debt accumulation rate, a forward-looking velocity benchmark, quantifies how quickly codebase quality deteriorates without intervention.
This often-overlooked velocity benchmark metric impacts long-term delivery capacity more than any other factor. Elite teams actively measure development velocity tracking indicators and manage technical debt as part of their weekly velocity benchmarks workflow.
These assessment methodologies provide different perspectives on technical debt. Organizations often combine multiple approaches for a more comprehensive view of their technical debt situation.
Technical debt velocity benchmarks measurement approaches include:
| Measurement Approach | Implementation Method | Pros | Cons |
| Code Quality Metrics | Static analysis tools | Objective, automated | May miss architectural issues |
| Velocity Decline | Sprint velocity tracking | Reveals impact on delivery | Lagging indicator |
| Effort Multiplier | Developer time estimation | Directly measures impact | Subjective, requires discipline |
| Bug Density | Bug tracking classification | Easy to implement | Indirect measurement |
Atlassian implemented a technical debt management system, allocating 20% of sprint capacity to remediation work. Their approach included categorizing debt by impact and implementing “debt ceilings” that triggered mandatory focus when thresholds were exceeded. This systematic approach maintained their delivery velocity even as their products scaled significantly.
6. Team Cognitive Load
Team cognitive load, an innovative velocity benchmark, measures the mental effort required for developers to understand and modify systems.
This emerging velocity benchmark metric directly impacts sustainability and scalability in development velocity tracking systems. Forward-thinking organizations monitor cognitive load velocity benchmarks to prevent burnout and maintain productivity.
These indicators help identify teams approaching cognitive overload before productivity and quality suffer.
Early detection allows for proactive intervention through system simplification or team restructuring.
- Increasing onboarding time for new team members
- Rising time spent understanding existing code before making changes
- Growing frequency of knowledge-related defects
- Decreasing confidence during deployments
- Increasing reliance on specific team members
Companies like GitLab measure cognitive load through regular team surveys and architecture reviews. They track system complexity metrics including cyclomatic complexity, component coupling, and documentation completeness. Their approach includes regular complexity budgeting sessions where teams evaluate cognitive costs of design decisions.
7. Value Stream Efficiency
Value stream efficiency, a holistic velocity benchmark, measures the end-to-end effectiveness of the entire software delivery pipeline. This comprehensive velocity benchmark metric reveals systemic bottlenecks beyond code development.
Elite organizations optimize their entire delivery value stream rather than focusing solely on coding efficiency when implementing development velocity tracking systems.
This value stream efficiency table breaks down performance expectations across the entire delivery pipeline. Each stage has specific metrics that enable targeted optimization efforts and process improvements.
| Pipeline Stage | Key Metrics | Target Efficiency |
| Requirements | Requirements stability, Feedback cycle time | < 10% churn, < 2 days |
| Design | Design approval time, Design revision rate | < 3 days, < 1.5 revisions |
| Development | Development cycle time, First-time pass rate | Varies by complexity, > 80% |
| Testing | Test execution time, Defect escape rate | < 1 hour, < 5% |
| Deployment | Deployment success rate, Deployment duration | > 95%, < 15 minutes |
| Production | Feature adoption, Customer feedback cycle | > 60%, < 7 days |
Shopify implemented value stream mapping across its entire development process. Their weekly efficiency reviews identified that code review represented their primary bottleneck.
Implementing automated pre-reviews and dedicated review time blocks reduced overall delivery time by 40%. Their approach focused on optimizing the entire pipeline rather than individual components.
Implementing a Weekly Velocity Tracking System
Implementing effective velocity benchmarks requires appropriate tools, processes, and cultural considerations.
Organizations must establish development velocity tracking systems that provide visibility without creating unnecessary overhead. These implementations succeed when they balance accountability with team empowerment.
The following sections outline key considerations for establishing your velocity benchmarks system with the right product team metrics.
1. The Technology Stack for Velocity Benchmarks Visibility
Modern development teams leverage specialized tools to collect and visualize velocity benchmarks automatically. These development velocity tracking tools minimize manual effort while providing comprehensive visibility into product team metrics.
An effective velocity benchmarking infrastructure captures data from multiple systems without disrupting the developer workflow.
This tool ecosystem comparison helps teams select appropriate solutions based on their specific needs and constraints. The right tooling combination creates visibility without excessive implementation complexity.
| Metric Category | Recommended Tools | Implementation Complexity | Monthly Cost Range |
| Deployment Metrics | CircleCI, GitHub Actions, Jenkins | Medium | $0-1000+ |
| Code Quality | SonarQube, CodeClimate, Codacy | Low-Medium | $0-300+ per seat |
| Issue Tracking | Jira, Linear, Azure DevOps | Low | $0-20 per user |
| Performance Monitoring | New Relic, Datadog, Dynatrace | Medium-High | $15-200 per host |
| Integrated Dashboards | Grafana, Tableau, PowerBI | Medium | $0-70 per user |
The implementation cost for comprehensive metrics automation typically ranges from $5,000 to $25,000, depending on team size and tooling choices.
Organizations consistently report ROI within 3-6 months through improved efficiency and reduced rework. The visibility gained from these investments enables data-driven improvement across the entire delivery pipeline.
2. The Weekly Velocity Benchmarks Review Meeting
Effective velocity benchmark reviews transform product team metrics into actionable improvements. These focused development velocity tracking meetings examine trends rather than individual data points.
The velocity benchmarks review structure promotes continuous improvement without creating blame or defensiveness. A template agenda for effective 15-minute velocity benchmark reviews includes the following points.
1. Metrics overview (2 minutes)
- Review the dashboard, highlighting significant changes
- Note any metrics approaching warning thresholds
2. Trend analysis (5 minutes)
- Examine 4-week trends for each core metric
- Identify positive improvements to reinforce
- Flag negative trends requiring intervention
3. Root cause discussion (5 minutes)
- Analyze factors driving metric changes
- Connect metric movements to specific actions or events
- Identify systemic issues versus temporary fluctuations
4. Action items (3 minutes)
- Determine 1-2 improvement actions for the coming week
- Assign clear ownership for each action
- Set measurable targets for improvement
This streamlined format maintains focus on continuous improvement rather than status reporting. Teams implementing this approach report higher engagement and more consistent progress. The brevity ensures regular participation without creating meeting fatigue.
3. Cultural Considerations for Velocity Benchmarks Implementation
Successful velocity benchmark programs require thoughtful implementation that reinforces positive team dynamics. Organizations must guard against development velocity tracking metrics becoming weapons or creating perverse incentives. Leadership plays a crucial role in establishing a healthy velocity benchmark culture with appropriate product team metrics.
These cultural principles ensure that metrics drive improvement rather than dysfunction. Organizations that follow these guidelines see sustained engagement with measurement systems rather than resistance or gaming behaviors. Key cultural considerations for velocity benchmarks include:
- Emphasize improvement over judgment
- Focus on team-level metrics rather than individual performance
- Maintain a transparent methodology for all measurements
- Involve teams in selecting and defining their metrics
- Recognize that metrics serve teams (not vice versa)
Microsoft’s developer division successfully implemented velocity benchmarks by starting with team-selected measurements before introducing standardized metrics.
Their velocity benchmarks approach emphasized using data for team empowerment rather than managerial control.
This velocity benchmarks philosophy resulted in greater buy-in and more meaningful improvements compared to top-down implementations.
Case Study: Velocity Benchmarks Transformation at Scale
Nationwide Insurance implemented comprehensive velocity benchmarks across its 2,000-person IT organization with remarkable results. Their transformation demonstrates how systematic development velocity tracking drives sustainable improvement at enterprise scale.
This transformation case study shows remarkable improvements across all key velocity benchmarks. The data demonstrates how systematic measurement enables significant performance gains even in large enterprise environments.
| Metric | Before (2018) | After (2021) | Improvement |
| Deployment Frequency | Monthly | Weekly | 4x increase |
| Lead Time | 45 days | 7 days | 84% reduction |
| Change Failure Rate | 35% | 12% | 66% reduction |
| MTTR | 24 hours | 3 hours | 87% reduction |
| Annual Deployments | ~2,400 | ~12,000 | 400% increase |
Their implementation timeline spanned 18 months across three phases:
1. Foundation (Months 1-6)
- Established baseline measurements
- Implemented CI/CD infrastructure
- Conducted a pilot with three teams
2. Expansion (Months 7-12)
- Rolled out to 25 additional teams
- Implemented a standardized metrics dashboard
- Established weekly review cadence
3. Enterprise Adoption (Months 13-18)
- Scaled to all development teams
- Integrated metrics with performance goals
- Implemented cross-team benchmarking
The initiative required approximately $3.5 million in tooling and training investments. It delivered estimated annual savings of $14 million through reduced rework and faster time-to-market. Leadership cited enhanced visibility as the single most important factor in their transformation success.
Benchmarking Your Team Against Industry Leaders
Understanding how your team compares to industry velocity benchmarks provides essential context for improvement initiatives.
This self-assessment helps prioritize efforts for maximum impact. Regular velocity benchmarking ensures continuous alignment with evolving industry standards.
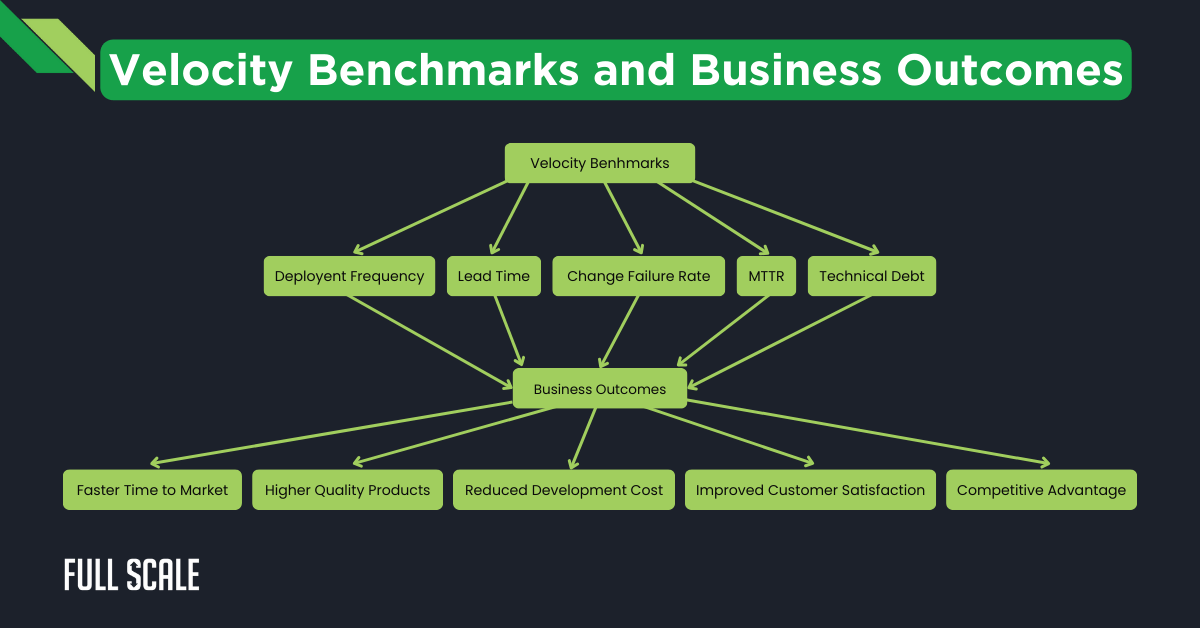
This flowchart shows how tracking and improving key velocity benchmarks leads to tangible business benefits. Each business outcome represents a competitive advantage that organizations gain through the effective implementation of velocity benchmarks.
This consolidated benchmarking framework enables organizations to assess their current performance level. Teams can use this data to identify their improvement priorities and set realistic targets for enhancement.
| Metric | Low Performers | Medium Performers | High Performers | Elite Performers |
| Deployment Frequency | Monthly or less | Weekly to monthly | Daily to weekly | Multiple times daily |
| Lead Time | 1+ month | 1 week to 1 month | 1 day to 1 week | Less than 1 day |
| Change Failure Rate | 46-60% | 31-45% | 16-30% | 0-15% |
| MTTR | 1+ week | 1 day to 1 week | 1 hour to 1 day | Less than 1 hour |
| Technical Debt Rate | Unmanaged growth | Monitored but growing | Stable | Declining |
| Test Automation | < 30% coverage | 30-60% coverage | 60-80% coverage | > 80% coverage |
| Build Time | > 30 minutes | 10-30 minutes | 5-10 minutes | < 5 minutes |
Red flags indicating velocity problems include:
These warning indicators help organizations identify delivery problems before they become critical. Early detection allows teams to implement corrective actions before performance degradation impacts business outcomes.
- Increasing lead times despite a stable team size
- Rising change failure rate over multiple sprints
- Developer complaints about environment stability
- Extended onboarding time for new team members
- Declining velocity despite consistent team composition
Velocity benchmarks assessments should occur quarterly to track progress against industry standards. Organizations should prioritize improvements in areas showing the largest gaps compared to desired performance levels.
This systematic velocity benchmarks approach ensures investments target the most impactful opportunities.
Velocity Benchmarks: The Competitive Edge
Velocity benchmark intelligence provides a substantial competitive advantage in today’s market. Organizations mastering these metrics deliver more value to customers in less time.
This capability translates directly to business outcomes, including faster innovation and higher customer satisfaction.
Successful velocity benchmark optimization balances speed with sustainability. Teams must avoid the trap of short-term acceleration that creates long-term technical debt. The velocity benchmarks framework presented here helps maintain this critical balance through comprehensive measurement.
Implementing weekly velocity benchmarks represents an essential step toward engineering excellence. Organizations beginning this journey should start with deployment frequency and lead time before expanding to additional metrics. This phased approach builds momentum while avoiding measurement overload.
The future of velocity benchmarks continues evolving with growing emphasis on business outcomes rather than technical metrics. Forward-thinking teams are already connecting delivery metrics to customer experience indicators.
This evolution ensures engineering velocity directly supports business objectives rather than becoming an end in itself.
Accelerate Your Delivery Pipeline with Full Scale’s Velocity Expertise
Implementing effective velocity benchmarks requires specialized expertise and robust implementation approaches. Development teams often struggle to establish measurement systems while maintaining delivery commitments.
At Full Scale, we specialize in helping businesses like yours build and manage development teams equipped with the skills and tools to implement, track, and optimize velocity benchmarks for maximum competitive advantage.
Why Choose Full Scale for Velocity Benchmark Mastery?
- Metrics-Driven Teams: Our experienced developers implement effective velocity benchmark systems aligned with industry best practices.
- Continuous Improvement Culture: Our teams bring established processes for turning velocity benchmarks into actionable improvements.
- Technical Excellence: We maintain high standards for code quality and automation that drive sustainable velocity improvements.
- Proven Results: Our clients consistently report deployment frequency improvements of 200% + and lead time reductions exceeding 60%.
Don’t let inefficient delivery processes limit your growth potential. Schedule a free consultation today to learn how Full Scale can help your team implement velocity benchmarks that drive competitive advantage.
Schedule Your FREE Velocity Benchmark Consultation
FAQs: Velocity Benchmarks
How do I start implementing velocity benchmarks in my organization?
Start with measuring just two key metrics: deployment frequency and lead time. Set up automated tracking using your existing CI/CD tools. Hold weekly 15-minute reviews focused on trends. After one month, add one additional velocity benchmark. Scale gradually to prevent overwhelming teams with too many product team metrics.
What’s the difference between velocity benchmarks and traditional Agile velocity?
Traditional Agile velocity measures story points completed per sprint—an internal productivity metric. Velocity benchmarks focus on delivery outcomes that impact customers, like deployment frequency and lead time. Velocity benchmarks correlate more directly with business results, while development velocity tracking provides a more holistic view of software delivery performance.
Which velocity benchmarks should we prioritize for regulated industries?
For regulated industries, prioritize these velocity benchmarks:
- Change failure rate (quality)
- Lead time (responsiveness)
- Technical debt accumulation rate (sustainability)
- MTTR (reliability)
These product team metrics balance compliance requirements with delivery performance while ensuring proper controls remain in place.
How can Full Scale help my organization implement effective velocity benchmarks?
Full Scale helps organizations implement velocity benchmarks through:
- Expert development teams with experience in establishing product team metrics
- Ready-to-use development velocity tracking tools and dashboards
- Team integration specialists who implement measurement systems
- Process optimization consultants who convert metrics into actionable improvements
- Proven experience improving deployment frequency by 200%+ for clients
How often should we recalibrate our velocity benchmark targets?
Recalibrate velocity benchmarks quarterly for established teams and monthly for new teams. Adjust targets when:
- You complete major architecture changes
- Team composition changes significantly
- After implementing new development velocity tracking tools
- When reaching elite performance in certain metrics
Annual assessments against industry benchmarks ensure your targets remain competitive.