Software Development Project Timeline: How CTOs Can Create Realistic Estimates That Work
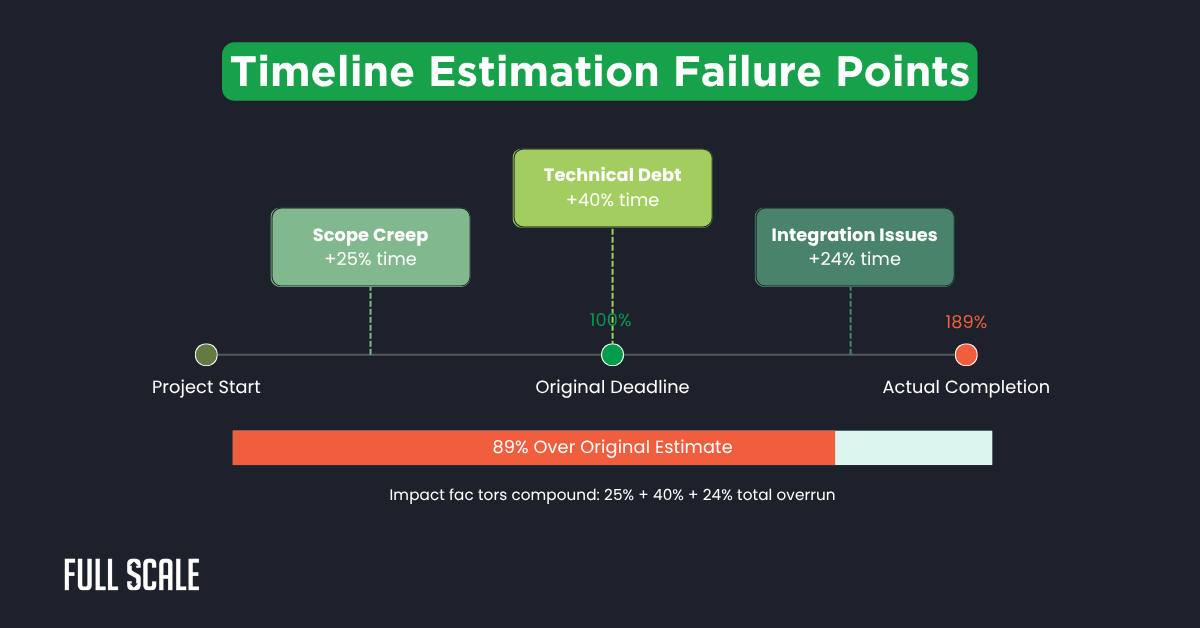
Creating an accurate software development project timeline remains the biggest challenge for engineering teams. Research shows 73% of projects exceed their timeline by 89% on average.
According to the 2024 Standish Group CHAOS Report, only 29% of IT projects finish on time and on budget. McKinsey’s 2023 study found that large software projects run 45% over budget and deliver 56% less value than predicted.
Every project starts with estimation challenges. Full Scale analyzed 500+ projects over 8 years, managing distributed teams. The data reveals exactly why realistic software development estimates fail and how to fix them.
Creating a successful timeline requires five steps: scope definition, complexity assessment, capacity calculation, risk buffer allocation, and continuous calibration. Most failures occur because teams skip the complexity assessment and risk planning phases. Without proper fixed-price project estimation, budgets spiral out of control.
Why Software Development Project Timeline Estimation Fails
Every timeline faces predictable failure points. Software development time estimation breaks down due to optimism bias (40% underestimation), hidden technical complexity, communication overhead (25-30% in distributed teams), scope creep, and unrealistic developer resource assumptions.
The 5 Critical Estimation Killers
Understanding why project timeline estimation fails helps teams avoid disasters. Full Scale identified these five root causes:
| Estimation Killer | Impact | How It Destroys Timelines |
| Optimism Bias | 40% underestimation | Teams assume best-case scenarios |
| Hidden Complexity | 40-75% added time | Technical debt and integrations surprise teams |
| Communication Overhead | 25-30% productivity loss | Distributed team coordination takes longer |
| Scope Creep | 50% timeline extension | “Small” changes accumulate rapidly |
| Resource Assumptions | 30-40% capacity loss | Meetings and admin eat development time |
Estimation Method Accuracy Comparison
Different software project estimation techniques yield vastly different results:
| Method | Accuracy | Best Use Case |
| Gut Feeling | 25% | Never use |
| Expert Judgment | 60% | Small, familiar projects |
| Three-Point (PERT) | 85% | Complex projects |
| Historical Data | 90% | Similar past projects |
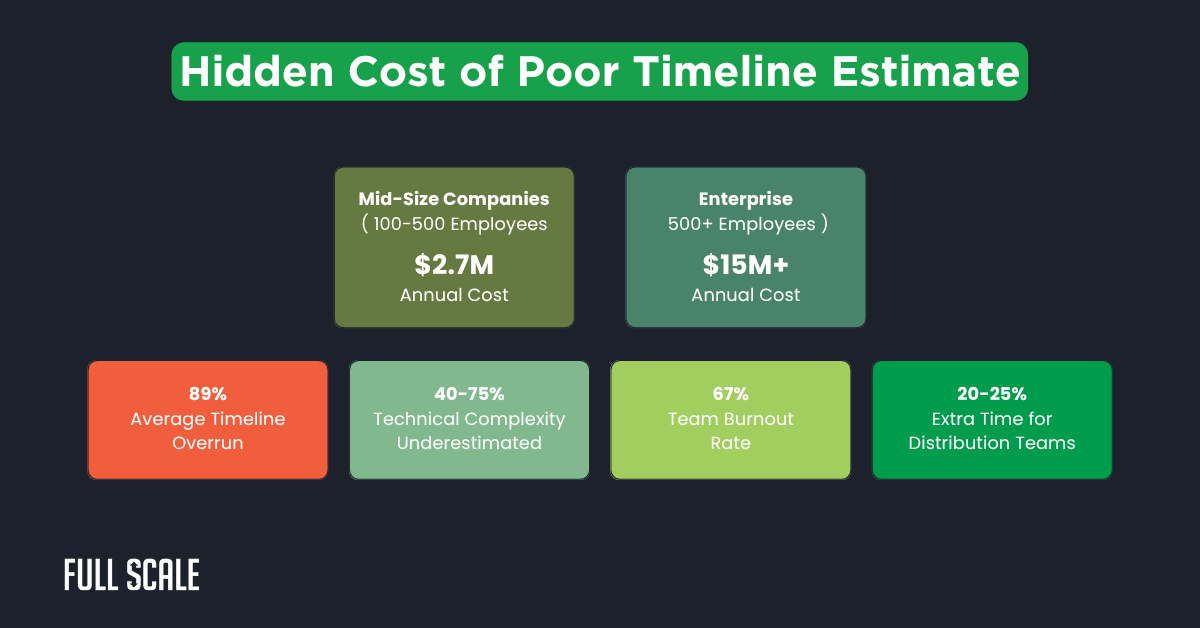
The Hidden Costs of Poor Timeline Estimation
Poor software development project timeline accuracy creates cascading failures. The financial impact extends beyond project overruns. When teams fail to estimate software project timelines properly, the ROI impact becomes devastating. Project planning suffers across the organization.
Technical Debt Impact on Project Timelines
Software development project timeline accuracy depends on accounting for technical debt. Teams wondering how long software development takes must factor in legacy code:
| Technical Debt Level | Timeline Impact | Codebase Age | Software Development Cost Impact |
| Low | +15% | < 1 year | $50K-$100K additional |
| Medium | +35% | 2-3 years | $150K-$300K additional |
| High | +75% | Legacy systems | $500K+ additional |
Formula: Timeline Impact = Base Estimate × (1 + Technical Debt Factor)
Team Turnover Impact on Timelines
Poor project timeline estimation directly correlates with developer retention. Teams failing at accurate estimation face severe consequences:
- Accurate estimation teams: 8% annual turnover
- Poor estimation teams: 24% annual turnover (3x higher)
- Developer replacement cost: $75,000-$150,000 per person
- Project budget timeline correlation: Each departure adds 2-3 months
The RAPID Framework for Timeline Success
Full Scale’s RAPID framework transforms software development project timeline accuracy. Teams achieve 85%+ estimation precision using this development methodology. The framework addresses all timeline challenges systematically.
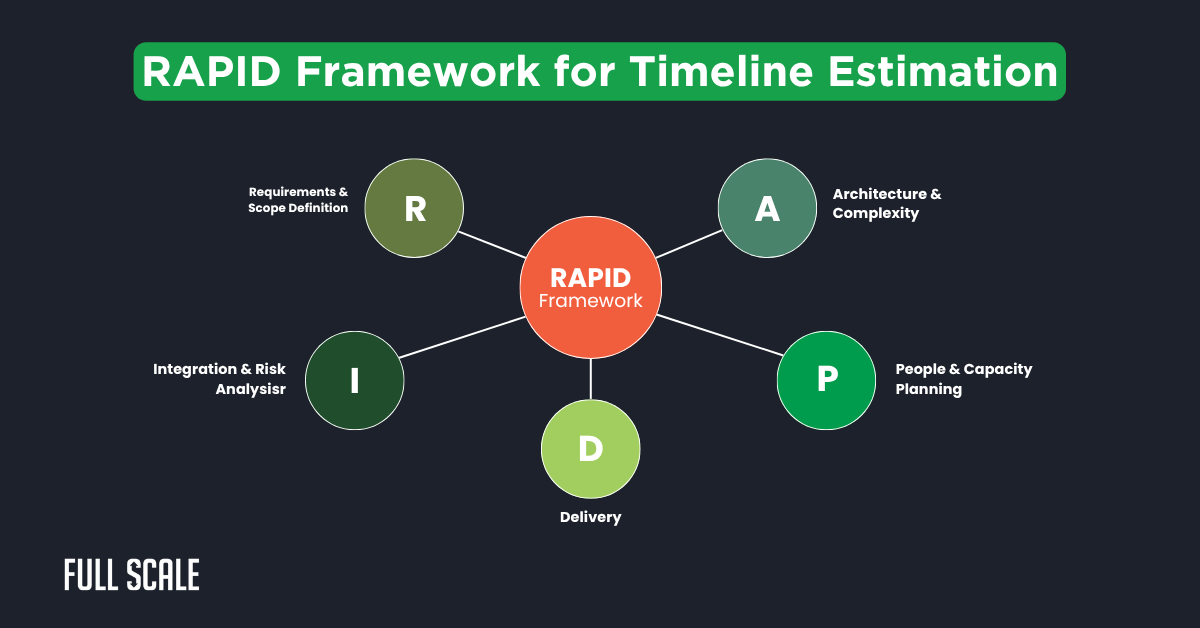
Step 1: Requirements & Scope Definition
An accurate software development project timeline starts with a crystal-clear project scope estimation. Poor requirements lead to 40% of timeline failures. Product managers must master feature development timeline estimation. Use this comprehensive checklist:
- Detailed user stories with acceptance criteria
- Non-functional requirements (performance, security)
- Integration points mapped and complexity scored
- Change management process agreed upon by all stakeholders
- Deployment planning requirements are documented early
Change Impact Formula: Timeline Impact = (New Feature Points ÷ Team Velocity) × 1.3
Step 2: Architecture & Complexity Assessment
Technical complexity drives timeline variance. Score each component:
| Complexity Level | Score | Examples | Time Multiplier |
| Simple | 1-3 | CRUD operations, basic UI | 1.0x |
| Medium | 4-6 | API integrations, data processing | 1.5x |
| Complex | 7-10 | Real-time systems, algorithms | 2.0x |
| New Technology | Any | First-time implementation | +50% |
| Legacy Integration | Any | Existing system connections | +75% |
Step 3: People & Capacity Planning
Calculate realistic team capacity for your software development project timeline:
Formula: Effective Hours = (Available Hours × Team Size × Productivity Factor) – (Meetings + Admin)
| Developer Level | Productivity Factor | Distributed Team Adjustment |
| Senior | 1.0 | Same timezone: 0% |
| Mid-level | 0.8 | 1-4 hour difference: -10% |
| Junior | 0.6 | 5+ hour difference: -20% |
| New (<3 months) | 0.4 | Multi-timezone: -25% |
Step 4: Integration & Risk Analysis
External dependencies destroy project timeline estimation. Add appropriate buffers:
- Technical risks: 15-25% buffer
- Team risks: 10-20% buffer
- External dependencies: 20-30% buffer
- New technology: 25-40% buffer
Step 5: Delivery & Buffer Calculation
Smart buffer allocation ensures a realistic software development project timeline:
| Team & Technology | Recommended Buffer |
| Experienced team + familiar tech | 20% |
| Mixed experience + standard tech | 25% |
| New team + cutting-edge tech | 35% |
Proven Estimation Techniques for Software Development Project Timeline
Three-Point Estimation (PERT Method)
The most accurate software project estimation technique uses this formula:
PERT Estimate = (Optimistic + 4×Most Likely + Pessimistic) ÷ 6
Example: User Authentication Feature
- Optimistic: 3 days
- Most Likely: 7 days
- Pessimistic: 14 days
- PERT Estimate: 7.5 days
Planning Poker for Distributed Teams
Modified agile estimation methods for remote teams:
- Async story review (24 hours advance)
- Sync estimation session (90 minutes max)
- Discuss outliers only
- Final consensus vote
Managing Risks in Your Software Development Project Timeline
Communication Overhead Formula
Calculate real communication time for distributed team timeline estimation:
Communication Overhead = (Team Size × (Team Size – 1)) ÷ 2 × Time Factor
| Team Structure | Time Factor |
| Co-located | 5% |
| Remote (same timezone) | 10-15% |
| Multi-timezone | 20-25% |
Quality Assurance Time Allocation
QA represents 40-60% of the development timeline planning:
- Unit testing: 30% of dev time
- Integration testing: 20% of dev time
- UAT: 15% of dev time
- Bug fixes: 25% of dev time
Tools for Software Development Project Timeline Management
Essential Tool Categories
| Tool Type | Purpose | Free Options | Professional |
| Estimation | Story pointing | Planning Poker apps | Jira |
| Tracking | Velocity metrics | Google Sheets | Azure DevOps |
| Visualization | Timeline views | Miro | Monday.com |
| Analysis | Historical data | Excel | Power BI |
Key Templates from Full Scale
- Technical Complexity Matrix
Technical Complexity Assessment Matrix
Project: Date:
Complexity Scoring Guide
Standard CRUD operations, basic UI components, well-documented APIs
Multiple integrations, moderate business logic, some performance requirements
Real-time processing, complex algorithms, high performance/security needs
Component Assessment
| Component/Feature | Description | Score | Risk Factors | Multiplier | Est. Days | Adjusted Days | Status |
|---|---|---|---|---|---|---|---|
| 5 | Security, Integration | 1.5x | 15 | In Progress | |||
| 3 | Large files, validation | 1.3x | 10.4 | Completed | |||
| 8 | Real-time data, Performance | 1.7x | 25.5 | Not Started | |||
| – | – | – | – | – |
Technical Debt
Technology Risk
Integration Complexity
Final Complexity Score
* Time multipliers compound when multiple risk factors are present
- Team Capacity Calculator
Team Capacity Planning Calculator
| Team Member | Role | Level | Productivity | Days Available | Time Off | Actual Days | Daily Hours | Total Hours |
|---|---|---|---|---|---|---|---|---|
| Developer | Senior | 1.0 | 9 | 72 | ||||
| Developer | Mid | 0.8 | 10 | 64 | ||||
| Developer | Junior | 0.6 | 8 | 38.4 | ||||
| QA Engineer | Senior | 1.0 | 9.5 | 76 | ||||
| TOTAL TEAM HOURS AVAILABLE: | 250.4 |
| Activity | % of Time | Hours/Person | Team Hours |
|---|---|---|---|
| Daily Standups | 5% | 3.8 | 12.5 |
| Sprint Ceremonies | 8% | 6.0 | 20.0 |
| Code Reviews | 10% | 7.5 | 25.0 |
| Documentation | 8% | 6.0 | 20.0 |
| Admin/Email | 7% | 5.3 | 17.5 |
| Unplanned Support | 10% | 7.5 | 25.0 |
| TOTAL DEDUCTIONS | 48% | 36.0 | 120.0 |
- Risk Assessment Worksheet
Risk Assessment & Buffer Worksheet
Risk Assessment Matrix
Risk Scores
| Risk Factor | Probability | Impact | Score | Buffer % | Mitigation Strategy |
|---|---|---|---|---|---|
| Unknown technical challenges | 9 | 25% | |||
| Performance requirements unclear | 6 | 20% | |||
| Security vulnerabilities | 3 | 15% | |||
| Technical Risk Buffer: | 25% |
| Risk Factor | Probability | Impact | Score | Buffer % | Mitigation Strategy |
|---|---|---|---|---|---|
| Key person dependency | 6 | 20% | |||
| Skill gaps | 4 | 15% | |||
| Team Risk Buffer: | 20% |
| Dependency | Critical? | Control Level | Risk Level | Buffer % | Backup Plan |
|---|---|---|---|---|---|
| Third-party APIs | Yes | 30% | |||
| Client approvals | Yes | 20% | |||
| External Dependency Buffer: | 30% |
| Risk Category | Buffer % | Base Timeline (days) | Buffer Days | Total Days |
|---|---|---|---|---|
| Technical Risks | 25% | 15 | 75 | |
| Team Risks | 20% | 60 | 12 | 72 |
| External Dependencies | 30% | 60 | 18 | 78 |
| Total Composite Buffer | 75% | 60 | 45 | 105 |
Final Timeline Calculation
Risk Monitoring Plan
Risk Distribution
Trigger Points for Re-assessment
- Dependency Mapping Template
Dependency Mapping Template
Dependency Chain Visualization
3 days
5 days
8 days
6 days
External
External
10 days
4 days
| Component A | Depends On | Component B | Type | Timeline Impact | Status | Owner | Notes |
|---|---|---|---|---|---|---|---|
| ← requires → | 3 days | Not Started | |||||
| ← requires → | 2 days | Completed | |||||
| ← requires → | 5 days | In Progress |
| Our Component | External Service | Type | Criticality | Lead Time | Status | Contact | Backup Plan |
|---|---|---|---|---|---|---|---|
| High | 1 week | Pending | |||||
| Medium | 3 days | Active | |||||
| Low | 2 days | Active |
| Feature/Module | Technical Requirement | Environment | Setup Time | Status | Responsible | Risk Level |
|---|---|---|---|---|---|---|
| 5 days | Not Started | High | ||||
| 3 days | Planning | Medium |
Critical Path Analysis
| Sequence | Components | Total Days | Bottleneck Risk |
|---|---|---|---|
| Path 1 |
Auth
→
Profile
→
Dashboard
→
Order
|
26 days | High |
| Path 2 |
Payment
→
Order
→
Notification
|
20 days | Medium |
Parallelization Opportunities
- Payment Module can start after User Profile (saves 6 days)
- Analytics setup parallel to main development (saves 4 days)
- Infrastructure setup can begin immediately (saves 5 days)
| Dependency | Single Point of Failure? | Alternative Available? | Impact if Delayed | Monitoring Plan | Action Required |
|---|---|---|---|---|---|
| Payment Gateway (Stripe) | Yes | Yes | High - No revenue | Daily health checks | Setup backup |
| User Database | Yes | No | Critical - System down | Real-time alerts | Add redundancy |
| CDN Service | Partial | Yes | Medium - Slow performance | Performance monitoring | Monitor only |
Timeline Impact Summary
Mitigation Strategies
Immediate Actions
- Setup Stripe API sandbox John D.
- Confirm database schema Sarah M.
- Configure CDN for video DevOps
- Test PayPal backup API Mike R.
Review Schedule
- Velocity Tracking Dashboard
Velocity Tracking Dashboard
Sprint Velocity Trend
| Sprint # | Start | End | Planned | Completed | Velocity | Team Size | Pts/Person |
|---|---|---|---|---|---|---|---|
| 1 | Jan 1 | Jan 14 | 50 | 48 | 48 | 5 | 9.6 |
| 2 | Jan 15 | Jan 28 | 55 | 56 | 56 | 5 | 11.2 |
| 3 | Jan 29 | Feb 11 | 52 | 52 | 52 | 5 | 10.4 |
| 4 | Feb 12 | Feb 25 | 58 | 60 | 60 | 6 | 10.0 |
| 5 | Feb 26 | Mar 11 | 60 | 58 | 58 | 6 | 9.7 |
| 6 | Mar 12 | Mar 25 | 65 | 62 | 62 | 6 | 10.3 |
| Average Velocity (Last 3 Sprints): | 60 | ||||||
| Average Velocity (Last 6 Sprints): | 56 | ||||||
| Velocity Trend: | Increasing |
| Sprint # | Total Stories | Accurate (±20%) | Overestimated | Underestimated | Accuracy % |
|---|---|---|---|---|---|
| 1 | 15 | 12 | 2 | 1 | 80% |
| 2 | 18 | 15 | 1 | 2 | 83% |
| 3 | 16 | 13 | 2 | 1 | 81% |
| 4 | 20 | 17 | 1 | 2 | 85% |
| 5 | 19 | 15 | 2 | 2 | 79% |
| 6 | 21 | 18 | 1 | 2 | 86% |
| Overall Estimation Accuracy: | 82% |
Velocity Analysis by Story Type
Story Types
Next Sprint Velocity (Predicted)
Backlog Completion
Team Capacity
Risk Status
| Team Member | Role | Avg Points/Sprint | Est. Accuracy | Availability |
|---|---|---|---|---|
| John Smith | Senior Dev | 15 | 88% | 95% |
| Sarah Lee | Mid Dev | 12 | 82% | 90% |
| Mike Chen | Junior Dev | 8 | 75% | 100% |
| Emma Davis | QA Engineer | 11 | 90% | 85% |
| Sprint | Holidays | Team Changes | Tech Issues | Impact |
|---|---|---|---|---|
| 1 | - | - | - | None |
| 2 | MLK Day | - | - | -5% |
| 3 | - | +1 Junior Dev | - | -8% |
| 4 | - | - | DB outage | -10% |
| 5 | - | - | - | None |
| 6 | - | - | - | None |
| Issue Identified | Action Item | Owner | Target Date | Status |
|---|---|---|---|---|
| Junior dev onboarding slow | Create mentorship program | John S. | Apr 15 | In Progress |
| Estimation accuracy declining | Refinement workshop | Sarah L. | Apr 10 | Complete |
| Tech debt increasing | Allocate 20% to tech debt | Team | Ongoing | Planned |
| Dependencies causing delays | Create dependency map | Mike R. | Apr 20 | Planned |
| Month | Avg Velocity | Total Points | Sprints | Major Achievements | Challenges |
|---|---|---|---|---|---|
| January | 52 | 156 | 3 | Auth system complete | Team ramp-up |
| February | 59 | 118 | 2 | Payment integration | DB outage impact |
| March | 62 | 62 | 1 | Dashboard launch | None |
Dashboard Notes
- Velocity Calculation: Only count fully completed stories
- Rolling Average: Use last 3 sprints for short-term planning
- Capacity Changes: Adjust for team size variations
- Review Frequency: Update after each sprint retrospective
Your 30-Day Software Development Project Timeline Transformation
Implementation Roadmap
Week 1: Foundation
- Collect historical project data
- Establish team capacity baseline
- Create estimation templates
Week 2: Process
- Train the team on the RAPID framework
- Run the first estimation workshop
- Set up tracking systems
Week 3: Application
- Apply to the current project
- Monitor daily results
- Gather team feedback
Week 4: Scale
- Adjust based on results
- Document lessons learned
- Expand to other teams
Build Accurate Timelines with Full Scale's Proven Framework
Accurate software development project timeline estimation transforms project success rates. Full Scale's RAPID framework reduces estimation errors by 60%+. The methodology works especially well for distributed teams tackling complex projects.
Ready to achieve 85%+ timeline accuracy? Full Scale's expert remote developers bring proven project timeline estimation expertise to your team.
Build Realistic Project Timelines, Let Us Help You
FAQs: Software Development Project Timeline
Q: Why are software development estimates always wrong? A: Software estimates fail due to optimism bias (40% underestimation), hidden technical complexity, communication overhead in distributed teams (25-30% loss), scope creep, and unrealistic resource assumptions.
Q: How do you calculate software development time? A: Use the RAPID framework: Define scope, assess complexity (1-10 scale), calculate team capacity with productivity factors, add risk buffers (20-35%), apply three-point estimation: (Optimistic + 4×Most Likely + Pessimistic) ÷ 6.
Q: How much does poor estimation cost companies? A: Poor estimation costs mid-size companies $2.7M annually, scaling to $15M+ for enterprises. This includes overruns, technical debt, team turnover (3x higher), and missed opportunities.
Q: What's the most accurate software estimation technique? A: Three-point estimation (PERT) combined with historical velocity data provides 85-90% accuracy. This method accounts for uncertainty while using past performance for calibration.
Q: How do distributed teams affect timeline estimation? A: Distributed teams require 10-25% additional time depending on timezone differences. Same-timezone remote teams need 10-15% extra, while multi-timezone teams need 20-25% additional time.
Q: What factors affect development timeline the most? A: Technical complexity (40-75% impact), scope changes (50% extension), team experience, external dependencies, and communication overhead for distributed teams significantly affect timelines.
Q: How to create realistic project estimates for agile teams? A: Use sprint planning with historical velocity, apply PERT estimation, include buffer for iteration cycles, and adjust for team capacity planning and technical complexity.
Q: What is three point estimation in project management? A: Three-point estimation calculates expected duration using optimistic, pessimistic, and most likely scenarios. Formula: (O + 4M + P) ÷ 6, providing probabilistic accuracy.
Q: How to use PERT estimation effectively? A: Gather three estimates per task, apply the formula, aggregate results, add risk buffers, and validate against historical data for similar projects.
Q: Agile estimation vs waterfall timeline - which is better? A: Agile allows iterative refinement with 15-20% better accuracy due to continuous feedback, while waterfall works for fixed-scope projects with clear requirements.
Q: How much buffer time to add to estimates? A: Add 20% for experienced teams on familiar tech, 25% for mixed teams, 35% for new teams/technology, plus 10-25% for distributed team coordination.
Q: What causes software projects to be late? A: Underestimating technical complexity (40-75% impact), unplanned scope changes, resource allocation issues, external dependencies, and poor risk assessment cause delays.Q: How long does software development take for different project sizes? A: Software development project timeline varies: Small projects (3-6 months), medium projects (6-12 months), large enterprise projects (12-24+ months), varying by complexity, team size, and scope definition.