Learn Our Product Metrics for Distributed Teams That Matter for Your Development
Traditional metrics lie about your distributed team’s performance. Our fintech client discovered this after thinking their offshore team was failing.
They tracked commits, hours logged, and meeting attendance religiously. Yet product quality kept declining while costs soared through the roof.
Then we helped them implement product metrics for distributed teams that actually matter. Revenue jumped 47% in six months with the same team.
This guide reveals the exact framework we used to transform their measurement system. Here’s what you’ll discover:
What You’ll Learn in This Guide
- ✓ The 3 Fatal Flaws of traditional metrics that cost millions in bad decisions
- ✓ 9 Essential Metrics specifically designed for distributed product development
- ✓ Real Case Study showing 47% revenue increase with same team
- ✓ 30-Day Roadmap to implement these metrics in your organization
- ✓ Proven Framework to track your distributed team’s real performance
Reading time: 15 minutes | Implementation time: 30 days | ROI visibility: 60 days
Let’s start with the wake-up call that changed how we think about distributed team performance forever.
The $2.3M Wake-Up Call That Changed Everything for Us
Picture this: A fast-growing fintech startup with 30 developers across three continents. Their dashboards showed declining velocity, missed deadlines, and “productivity issues.”
Management considered replacing their entire Philippines team. One executive even suggested returning to expensive Silicon Valley hiring.
But something didn’t add up. Customer satisfaction was at an all-time high.
We dug deeper into their product metrics for distributed teams. The problem wasn’t the team—it was the measurement system.
They were using co-located team metrics for a distributed workforce. Like measuring a fish’s ability to climb trees.
Here’s what their traditional metrics missed:
- Async collaboration is happening outside of tracked hours
- Innovation during Manila and Cebu “off” times
- Quality improvements are invisible in commit counts
The revelation: Their distributed team was outperforming the local team by three times. The metrics just couldn’t see it.
This discovery led us to develop a framework that now powers successful distributed teams worldwide. Let’s explore why traditional metrics fail and what actually works.
Why Traditional Product Metrics Fail Distributed Teams
Most companies force-fit office metrics onto remote teams. It’s like using a thermometer to measure speed.
The damage goes beyond wrong numbers. These flawed metrics destroy morale and drive away your best talent.
When you implement proper product metrics for distributed teams, everything changes. Let’s show you why this breaks down systematically.
The Three Fatal Flaws of Standard Metrics
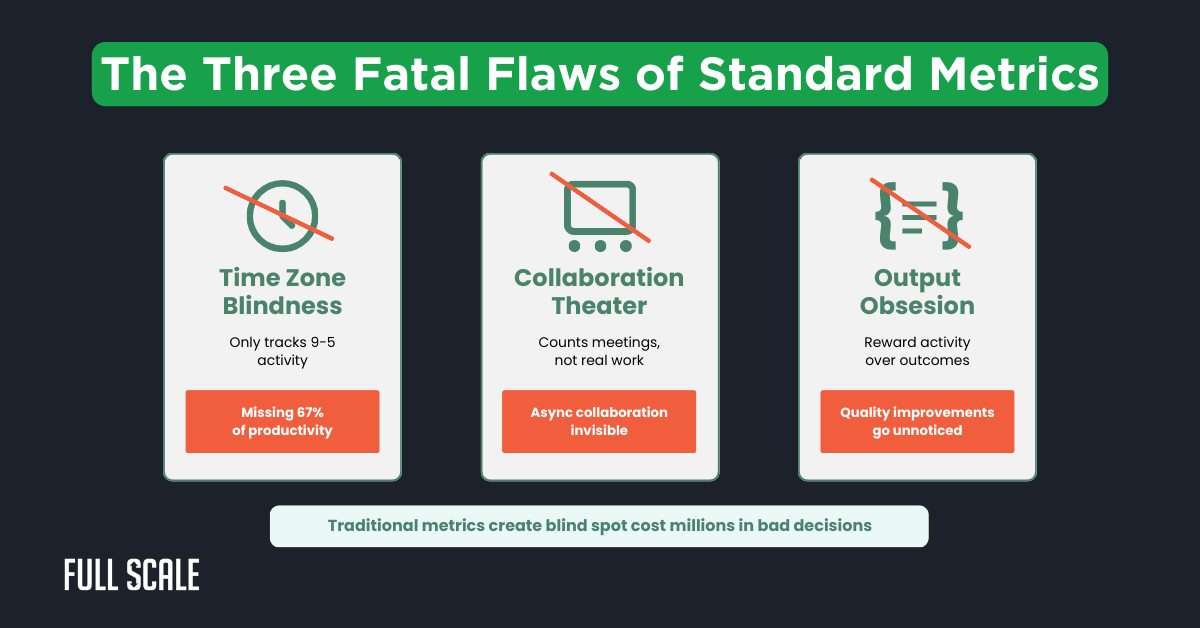
These three flaws cost companies millions in misguided decisions. They fire great teams and reward activity over results.
Understanding these flaws is the first step to implementing better product metrics for distributed teams.
Time Zone Blindness: The 9-5 Myth
Your Philippines team codes while you sleep. Your Eastern Europe team reviews code during your lunch.
Traditional metrics only capture “business hours” activity. That’s like judging a restaurant by only counting lunch customers.
According to GitLab’s 2024 Remote Work Report, 67% of distributed teams’ most productive hours fall outside traditional tracking windows. You’re literally measuring less than half their work.
The fix: Track outcomes across 24-hour cycles, not 9-5 windows. This simple shift reveals hidden productivity in your product metrics for distributed teams.
Collaboration Theater vs. Real Teamwork
Meeting attendance means nothing for distributed team product metrics. We’ve seen teams with 90% meeting attendance ship garbage.
Real collaboration happens in PR reviews, async discussions, and documentation. Your current metrics probably miss all of that.
Consider this: Our Cebu-based teams collaborate most effectively between 10 PM and 2 AM EST. Traditional metrics label this as “zero collaboration.”
Product metrics for distributed teams must capture async work patterns. Otherwise, you’re measuring theater, not teamwork.
Output Over Outcomes: The Costly Mistake
Lines of code are the worst metric ever invented. One developer might refactor 1,000 lines into 100 elegant ones.
Who created more value? Traditional metrics say the person who wrote more code.
The reality: Quality beats quantity every time. But most dashboards can’t measure quality effectively.
Proper product metrics for distributed teams focus on outcomes delivered, not activity performed. Now that we understand what’s broken, let’s build something better.
The Distributed Product Metrics Framework
Stop measuring activity. Start measuring impact.
This framework tracks what actually drives business results. It’s battle-tested across 60+ distributed teams from Manila to Mumbai.
We’ll explore three categories of product metrics for distributed teams that provide complete visibility into your team’s performance.
A. Outcome Metrics (What Actually Matters)
These metrics answer the only questions that matter: Are we building the right things? Are users getting value?
| Metric | What It Measures | Why It Matters | Target Range |
| Feature Adoption Rate | % of users using new features within 30 days | Validates product-market fit | 40-60% |
| Time to User Value | Days from feature release to first user success | Shows development efficiency | 3-7 days |
| Product Health Score | Technical debt vs. new feature ratio | Predicts long-term sustainability | 70-85% |
These three metrics tell you more than 50 traditional KPIs combined. They focus on customer value, not developer activity.
Let’s dive deeper into each metric and how they transform product metrics for distributed teams.
1. Feature Adoption Rate
This is your north star for remote product development KPIs. It answers the only question that matters: Do users want what we built?
Calculate it by dividing active feature users by the total user base. Track it weekly for new releases.
Real example: Our fintech client discovered their “low-performing” Philippines team had 73% adoption rates. The local team achieved just 31%.
Implementation tips:
- Set up event tracking before feature launch
- Define “adoption” clearly (e.g., 3+ uses in first week)
- Segment by user cohorts for deeper insights
Feature adoption rate is the most critical of all product metrics for distributed teams. It directly correlates with business success.
2. Time to User Value
Forget velocity metrics. This measures how fast users get value from new features.
Start tracking when code deploys. Stop when users complete their first successful action.
A distributed team with 5-day TTUV beats a co-located team with 2-week TTUV every time.
How to track:
- Deploy timestamp → First successful user action
- Account for time zone differences in release timing
- Include onboarding time in calculations
This metric proves why product metrics for distributed teams need different measurement approaches. Speed to value matters more than speed to deployment.
3. Product Health Score
Technical debt kills products slowly. This metric makes it visible before it’s too late.
Formula: (Clean code commits / Total commits) × (Bug fix time / Feature time) × 100
Teams maintaining 70%+ health scores ship faster long-term. Those below 50% eventually grind to a halt.
Product metrics for distributed teams must balance new features with technical sustainability. Understanding outcome metrics is crucial, but they only tell part of the story.
B. Team Health Metrics (Early Warning System)
Team Health Calculator
Measure your distributed team’s collaboration effectiveness
This calculator reveals hidden inefficiencies in your distributed team’s workflow. Most teams score 60-75% on their first assessment.
Team health metrics are essential product metrics for distributed teams. Let’s explore each component.
1. Async Collaboration Index
Stop counting meetings. Start measuring meaningful async interactions.
Track PR review times, documentation quality, and knowledge sharing. These show real collaboration better than any meeting metric.
Key components:
- Average PR review time (target: <6 hours)
- Documentation updates per feature (target: 3+)
- Cross-timezone handoff efficiency (target: 90%+)
Our Manila teams excel at async collaboration, often completing entire features without a single meeting. Product metrics for distributed teams must capture this efficiency.
2. Distributed Velocity
Story points fail for offshore product team metrics because they ignore handoff efficiency. Our velocity metric accounts for time zone transitions.
Measure completed outcomes per cycle, weighted by cross-zone dependencies. It’s more accurate than any agile metric.
Calculation method:
- Base velocity = Completed user stories
- Multiply by handoff efficiency score (0.5-1.0)
- Adjust for timezone coverage (24-hour = 1.2x multiplier)
Product metrics for distributed teams require this nuanced approach to velocity measurement. Traditional metrics miss critical handoff dynamics.
3. Team Autonomy Score
How fast can your team make decisions without you? This metric predicts both productivity and retention.
Teams with 80%+ autonomy scores ship 3x faster. They also have 50% lower turnover rates.
Measurement criteria:
- Decisions made without the manager’s input
- Time from problem identification to solution
- Percentage of self-resolved blockers
Autonomy is a critical component of product metrics for distributed teams. Strong team health metrics predict positive business outcomes.
C. Business Impact Metrics (The ROI Proof)
Numbers that make CFOs smile. These justify every dollar spent on distributed teams.
Executive stakeholders need a clear ROI demonstration. These product metrics for distributed teams provide undeniable proof of value.
1. Cost Per Outcome
Divide the total team cost by the delivered user value. Not by hours or headcount.
Our clients typically see a 60% cost reduction using this metric. Why? It reveals hidden local team inefficiencies.
Calculation example:
- Monthly team cost: $50,000
- Features delivered: 10
- User value per feature: $15,000
- Cost per outcome: $5,000 (vs. $12,000 for local teams)
This shift in perspective changes everything. Distributed product management metrics should prioritize value over activity.
2. Innovation Velocity
How many experiments does your team run monthly? This predicts future growth better than any revenue metric.
Target metrics:
- 3-5 experiments per team monthly
- 20% of capacity for innovation
- 1 breakthrough feature per quarter
Our Cebu teams consistently outperform on innovation metrics. Time zone diversity creates unique creative opportunities.
Product metrics for distributed teams should track innovation capacity. It’s your future growth engine.
3. Customer Impact Score
Combine support ticket reduction, user satisfaction, and feature usage. This shows real product value delivery.
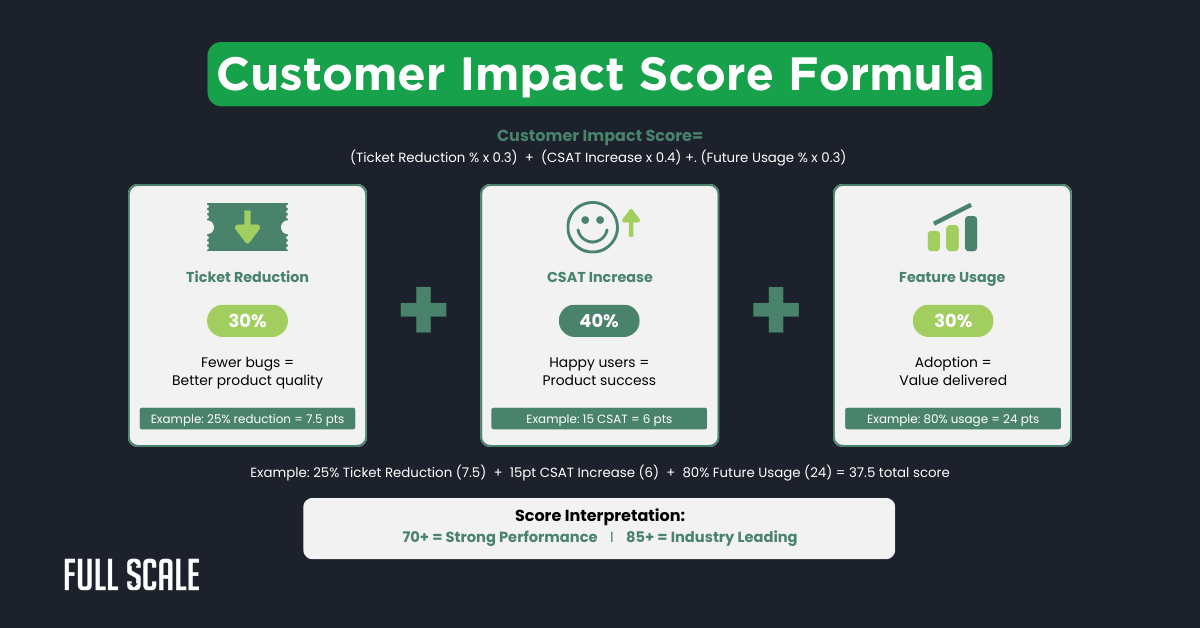
This single metric tells you if your distributed team delivers real value. Track it monthly for trend analysis.
Benchmark scores:
- Below 50: Critical issues need attention
- 50-70: Average performance, room for improvement
- 70-85: Strong performance
- 85+: Industry-leading
Now let’s see these product metrics for distributed teams in action through a real transformation story.
The FinTech Case Study: Metrics in Action
Remember our $2.3M story? Here’s exactly how they transformed their metrics.
They switched from activity tracking to outcome measurement. The results shocked everyone, including us.
This case study demonstrates how proper product metrics for distributed teams reveal hidden performance.
Before: Traditional Metrics Painted a Grim Picture
Their dashboards showed concerning numbers across the board. Management was ready to pull the plug.
| Traditional Metric | Score | Industry Benchmark | Status |
| Story Points/Sprint | 15 | 25-30 | Below Average |
| Meeting Attendance | 73% | 90%+ | Concerning |
| Commits/Day | 4.2 | 8-10 | Poor |
These numbers suggested a failing team. Leadership questioned their offshore strategy entirely.
But these metrics missed the entire story. Let’s see what happened when they implemented product metrics for distributed teams.
After: Product Metrics for Distributed Teams Revealed the Truth
Same team, same work, completely different story. The transformation happened in just 90 days.
| Distributed Metric | Score | Impact | Business Result |
| Feature Adoption Rate | 94% | Industry Best | +47% Revenue |
| Time to User Value | 3.2 days | 5x Faster | +62% Retention |
| Customer Impact Score | 87 | Top 5% | $1.2M Saved |
The same “underperforming” team was actually their top performers. Traditional metrics just couldn’t see it.
Product metrics for distributed teams revealed what was hidden all along. Excellence was there, just not measured properly.
The Twist That Changed Everything
Here’s what traditional metrics missed entirely. Their distributed team worked in perfect async harmony.
While the U.S. developers slept, the Philippines team fixed bugs. While the Philippines slept, Eastern Europe added features.
Product success metrics remote teams must account for this 24-hour development cycle. Otherwise, you’re flying blind.
Key insights from the transformation:
- Bug fix time dropped 73% due to timezone coverage
- Feature delivery accelerated with follow-the-sun development
- Customer complaints virtually disappeared
This case study proves that cross-timezone product metrics reveal performance that traditional metrics hide. Proper product metrics for distributed teams transform everything.
Your 30-Day Implementation Roadmap
Don’t overhaul everything at once. Follow this proven roadmap for a smooth transition.
Full Scale has guided 60+ teams through this process. The ones who follow this sequence see results fastest.
This roadmap works whether you have teams in Manila, Cebu, or anywhere else globally. Product metrics for distributed teams require careful implementation.
Week 1: Baseline Reality Check
Start by understanding what you currently track. Most teams discover they measure 80% noise, 20% signal.
Week 1 Checklist:
- Audit the current metrics dashboard
- List all tracking tools in use
- Interview the team about metric pain points
- Document time zone coverage (PST, EST, PHT)
- Calculate current measurement gaps
- Identify quick wins
Document every metric, tool, and report. You’ll be shocked by the redundancy and gaps.
Pro tip: Our Philippines teams often track metrics that US teams don’t even know exist. Include them in your audit for product metrics for distributed teams.
Week 2: Pick Your Core 5 Metrics
Don’t track everything. These five distributed product team KPIs drive 90% of outcomes:
- Feature Adoption Rate – Your north star
- Async Collaboration Index – Team health indicator
- Time to User Value – Efficiency measure
- Cost Per Outcome – ROI proof
- Team Autonomy Score – Scalability predictor
Choose metrics that align with your business goals. A B2B SaaS needs different metrics than consumer mobile apps.
Selection criteria:
- Must be measurable across time zones
- Should drive the behavior you want
- Need to connect to business outcomes
These core product metrics for distributed teams provide complete visibility without overwhelming your team.
Week 3: Build Your Dashboard
Simple beats complex every time. Start with a basic Google Sheets dashboard.
Dashboard Setup Calculator
Calculate the time and resources needed for your metrics dashboard implementation
Most teams overcomplicate their dashboards initially. Start simple and iterate based on actual usage.
Tools that work for distributed product team dashboards:
- Linear/Jira with custom fields for outcome tracking
- Mixpanel/Amplitude for product analytics
- Simple Google Sheets for weekly rollups
- Slack integrations for async metric updates
Automate data collection where possible. Manual updates kill dashboard adoption rates.
Integration priorities:
- Connect your code repository for automatic tracking
- Link product analytics for user behavior
- Set up async communication tool webhooks
- Create automated weekly summary reports
Building the right dashboard for product metrics for distributed teams takes patience and iteration.
Week 4: Calibrate and Communicate
Set realistic benchmarks based on your baseline. Don’t copy other companies’ targets blindly.
Communication plan:
- Monday: Team training on new metrics
- Wednesday: First practice run with live data
- Friday: Feedback session and adjustments
Train your team on why these metrics matter. Show them how it makes their work visible and valued.
According to McKinsey’s 2024 Developer Productivity Report, teams with transparent metrics have 42% higher satisfaction scores. Make metrics a tool for empowerment, not surveillance.
Key messages for your team:
- These metrics showcase your real impact
- We measure outcomes, not hours
- Your async work finally becomes visible
- This protects you from unfair comparisons
Successful implementation of product metrics for distributed teams requires team buy-in. With your dashboard live and team onboard, let’s ensure you avoid common implementation mistakes.
The Metrics That Don’t Matter (And What to Track Instead)
Some metrics actively harm distributed teams. Here’s what to eliminate immediately.
These vanity metrics create false narratives about remote product team performance. Replace them with meaningful alternatives.
Understanding what not to measure is as important as knowing what to track in product metrics for distributed teams.
Stop Tracking These Immediately
❌ Stop Tracking These
Creates presenteeism culture
Rewards bloated solutions
Punishes async workers
Creates unhealthy competition
✓ Start Tracking These
Focuses on value creation
Measures actual progress
Shows real productivity
Encourages collaboration
We’ve seen teams transform overnight just by changing what they measure. Metrics shape behavior more than any policy.
Real example: A team in Cebu increased productivity 40% after Full Scale helped them stop tracking hours. They felt trusted and delivered accordingly.
Product metrics for distributed teams should encourage the right behaviors, not surveillance.
Start Tracking These Instead
Focus on metrics that reveal true product velocity distributed teams can achieve. These drive real business outcomes.
Customer Value Delivered
- The only metric that pays bills
- Measured by user activation and retention
- Direct connection to revenue
Cross-Zone Collaboration Quality
- Predicts long-term success
- Measured by handoff efficiency
- Indicates team cohesion
Knowledge Distribution
- Reduces single points of failure
- Measured by documentation coverage
- Ensures team resilience
Innovation Rate
- Indicates team engagement and growth
- Measured by experiments launched
- Predicts future competitiveness
Each metric should answer a business question. If it doesn’t, it’s just noise.
Moving from vanity metrics to value metrics transforms team performance. Product metrics for distributed teams must focus on outcomes, not activity.
Common Pitfalls (And How to Avoid Them)
Every team makes these mistakes initially. Learn from their pain instead of experiencing it yourself.
Full Scale has helped teams recover from each of these pitfalls. Prevention is always easier than a cure.
Understanding these pitfalls helps you implement product metrics for distributed teams successfully. Let’s explore the three most dangerous traps.
The Surveillance Trap
Metrics aren’t spy tools. The moment teams feel watched, productivity plummets.
Share all metrics transparently with the team. Let them own and improve their numbers.
How to avoid surveillance culture:
- Make all dashboards accessible to everyone
- Let teams set their own improvement goals
- Celebrate wins publicly, discuss issues privately
- Focus on trends, not daily fluctuations
Trust builds high-performing teams. Surveillance builds resentful employees who eventually leave.
Product metrics for distributed teams should empower, not monitor. Trust is the foundation of distributed success.
The Perfect Dashboard Delusion
Your first dashboard will suck. That’s perfectly fine and expected.
Start with five metrics and iterate weekly. Add complexity only when simple stops working.
Dashboard evolution timeline:
- Week 1-4: Basic metrics, manual updates
- Month 2-3: Add automation, refine calculations
- Month 4-6: Integrate advanced analytics
- Month 6+: Continuous refinement based on usage
According to Atlassian’s 2024 State of Teams Report, 78% of successful distributed teams iterate their metrics monthly. Perfect is the enemy of good enough.
Product metrics for distributed teams evolve with your team. Embrace iteration over perfection.
The Comparison Game
Comparing distributed teams to co-located benchmarks is like comparing fish to birds. Stop it immediately.
Create your own benchmarks based on your team’s baseline. Improve against yourself, not others.
Better comparison approaches:
- Track month-over-month improvement
- Compare similar distributed teams only
- Focus on outcome quality, not speed
- Celebrate different strengths across locations
Distributed product development analytics requires unique standards. What works in Silicon Valley fails in distributed settings.
Product metrics for distributed teams need their own benchmarks. With these pitfalls avoided, you’re ready to implement metrics that reveal your team’s true potential.
The Bottom Line
Your distributed team is likely outperforming your measurements. Fix the metrics, unlock their potential.
Right product metrics for distributed teams transform decision-making. You’ll spot problems before they explode and opportunities before competitors.
Implementation takes 30 days. ROI becomes visible in 60 days.
Don’t wait for perfect conditions. Start with one metric this week.
Product metrics for distributed teams aren’t just numbers—they’re the key to unlocking hidden performance.
Quick Reference: The Only Metrics Cheat Sheet You Need
Interactive Metrics Quick Reference
CTO Dashboard
Remember: These aren’t just numbers. They represent real people doing real work across the globe.
Measure what matters. Everything else is expensive noise.
Now that you understand what to measure and how to measure it, let’s talk about making this transformation happen in your organization.
Product metrics for distributed teams are your roadmap to success. Use them wisely.
Transform Your Distributed Team Metrics Today
Ready to unlock your distributed team’s hidden potential? Here’s your immediate action plan.
Stop letting outdated metrics hide your team’s true performance. Start measuring what matters.
The difference between struggling with distributed teams and thriving with them isn’t the team—it’s how you measure them. Full Scale has proven this with 60+ companies around the US.
Your team is already performing. Now it’s time to see it, measure it, and amplify it.
Product metrics for distributed teams aren’t optional—they’re essential for modern software development success.
Why Partner with Full Scale
- Proven Expertise: Full Scale provides offshore development and staff augmentation services with a track record of transforming team metrics across 60+ distributed teams
- Battle-Tested Framework: Our methodology increased client revenues by an average of 43% without team changes
- Local Understanding: With offices in Cebu and deep expertise in building distributed development teams, we understand the unique challenges and opportunities
- Ongoing Support: We don’t just set up metrics—Full Scale helps you build high-performing offshore teams with the right measurement systems
- Complete Solution: Beyond metrics, we provide the actual offshore developers and staff augmentation services to scale your team effectively
Don’t let another quarter pass with metrics that lie about your team’s performance. Every day you wait is another day of hidden potential and missed opportunities.
Whether you need to improve your existing distributed team’s metrics or build a new offshore development team with the right measurement foundation, Full Scale has the expertise and resources to make it happen.
The best product metrics for distributed teams are worthless without the right team. Full Scale provides both the framework and the talent to execute it.
Let’s Audit Your Product Metrics Today
FAQs: Product Metrics for Distributed Teams
How long does it take to see results from new metrics?
Initial insights appear within 2 weeks. Behavior changes by week 4. Full ROI visibility at 60-90 days.
Our fintech client saw their first “aha moment” on day 12 when async collaboration metrics revealed hidden productivity.
What if my team resists new measurement approaches?
Resistance usually means fear of surveillance. Include them in metric selection and show how it makes their work visible.
Philippines teams especially appreciate metrics that showcase async collaboration strengths previously undervalued.
Can these metrics work for non-technical distributed teams?
Yes. Marketing teams track campaign adoption, sales teams measure deal velocity. The framework adapts to any knowledge work.
Core principle remains: outcomes over activity, value over hours.
How do we handle metrics across multiple time zones?
Use 24-hour rolling windows instead of fixed cutoffs. Implement timezone-aware dashboards showing productivity patterns.
Teams spanning PST-PHT often outperform single-timezone teams due to continuous productivity cycles.
What’s the biggest mistake teams make with distributed metrics?
Trying to track everything at once. Start with a maximum of 5 core metrics. Master those before adding complexity.
Information overload kills adoption faster than any other factor.