Offshore Software Development Rates by Country in 2026: A CEO’s Honest Guide

In this article
- Offshore Software Development Rates by Country (2026)
- Rates Vary by City Within a Country
- What Determines Offshore Developer Rates
- Why I Picked the Philippines for Full Scale
- How to Pick the Right Offshore Country for Your Team
- Compare the Philippines to Specific Offshore Destinations
- Frequently Asked Questions About Offshore Software Development Rates
- The Bottom Line
My take on offshore developer rates starts with one thing: there are smart people all over the world.
Cheap rates by themselves don’t make a project work, which is why we put together a separate guide on the cheapshoring trap and how to capture global cost arbitrage without sacrificing quality or IP protection. Those country rates ultimately trace back to local economics, the same reason the cost to hire a software developer depends on their location.
I’ve worked with developers personally in Russia, Belarus, Latin America, India, Pakistan, and the Philippines. Of all of them, the best offshore developers I’ve worked with came from the Philippines. Finding smart developers anywhere in the world is the easy part.
The hard part is communication.
Software development is about communication more than anything else, and that’s where most offshore engagements actually fail. English fluency matters, cultural expectations matter, and whether a developer will speak up when they don’t understand something or push back when the spec is wrong matters more than the hourly rate on their invoice.
With that framing in mind, here’s what offshore software development actually costs in 2026, and the part most rate guides skip: what the developer earns is not what you get charged, and the gap between those two numbers is where the real story is. That gap runs through the whole market, which we map in the state of IT staffing.
Offshore Software Development Rates by Country (2026)
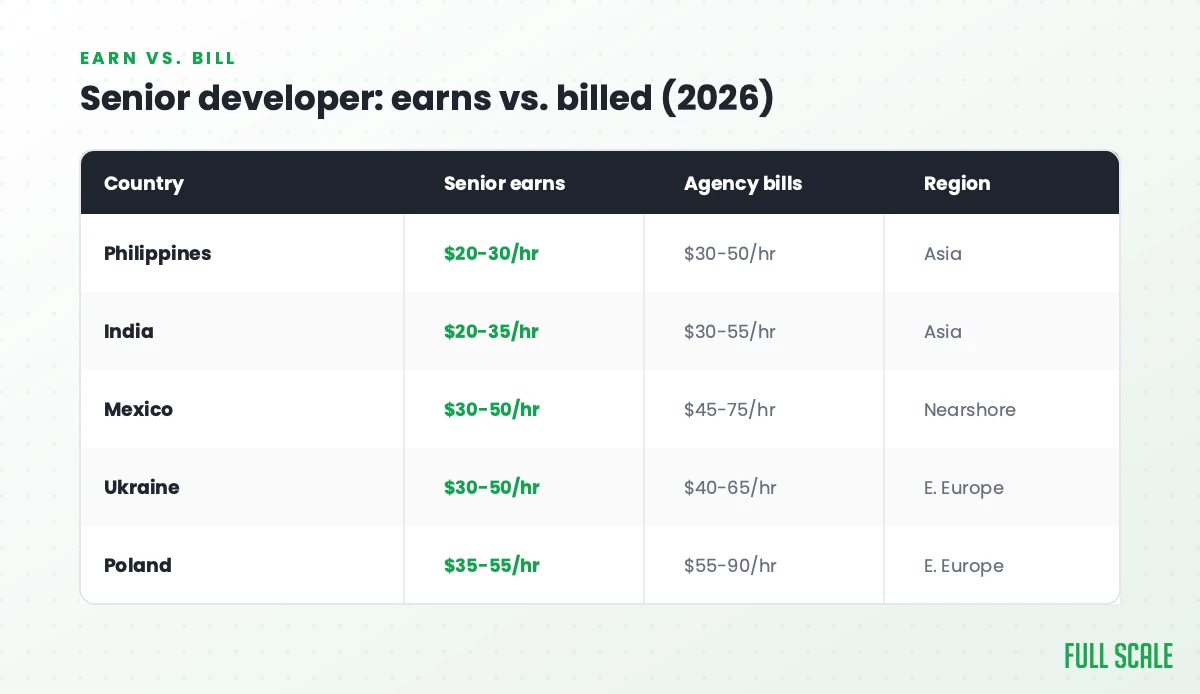
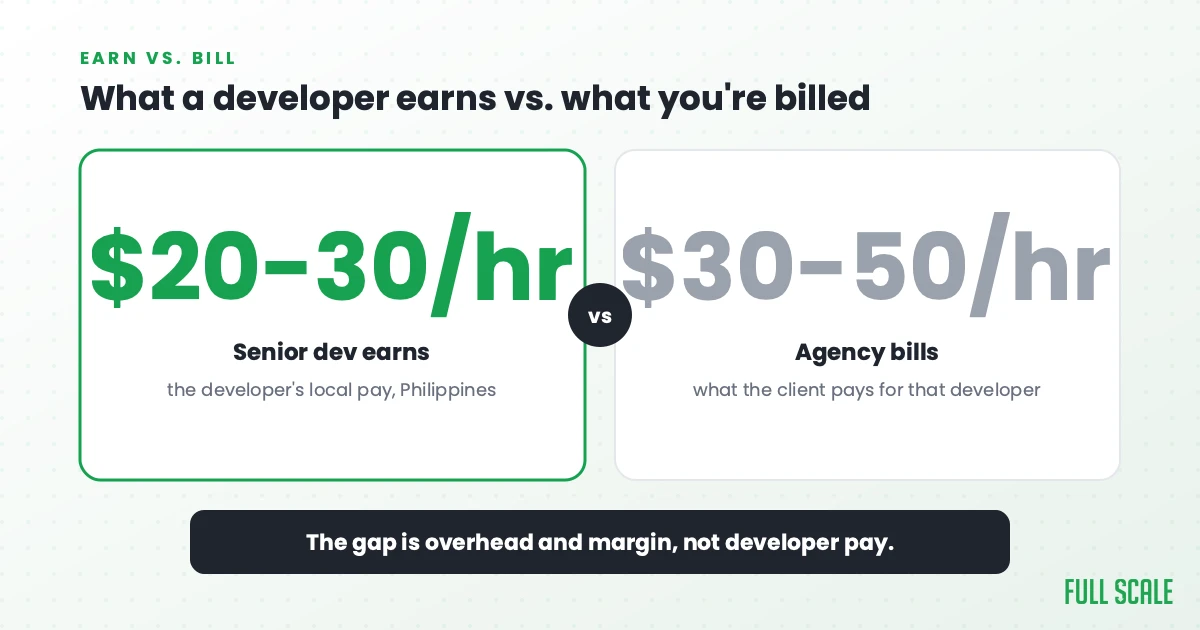
Most rate tables you’ll find online quote one number per country with no source and no methodology. We’re going to do it differently, with two numbers per country: what a senior developer actually earns locally, and what an agency or staff-aug partner typically bills a US client for that developer. The gap between them is overhead and margin, not developer pay. The Philippine side is the one I get asked about most, so I broke out software developer salaries in the Philippines by seniority in a separate post.
These are senior ranges on purpose. Junior rates drag the averages down and most rate cards blur the two together, which is how you end up comparing a junior in one country to a senior in another. Everything below is a working senior engineer with real experience.
| Country | Senior dev earns | Agency bills (senior) | Notes |
|---|---|---|---|
| Philippines | $20-30/hr | $30-50/hr (Full Scale $35) | Best English fluency in Asia. Communication-first hire. |
| Vietnam | $18-30/hr | $30-50/hr | Fast-growing. Strong engineering schools. |
| India | $20-35/hr | $30-55/hr | Largest talent pool. English fluency varies. |
| Brazil | $25-45/hr | $50-80/hr | Largest LatAm pool. Nearshore overlap. |
| Argentina | $25-45/hr | $40-65/hr | Nearshore. Peso volatility; figures are an estimate. |
| Romania | $30-45/hr | $40-60/hr | EU-aligned. Strong backend and security. |
| Mexico | $30-50/hr | $45-75/hr | Tightest US time-zone alignment. |
| Ukraine | $30-50/hr | $40-65/hr | Deep talent pool. Wartime caution applies. |
| Poland | $35-55/hr | $55-90/hr | Premium Eastern Europe rate. EU-aligned. |
The Philippines row shows Full Scale’s actual published rate of $35 an hour, fully loaded, which sits inside the typical market billing range. Notice the pattern: a senior developer earning $20 to $30 an hour gets billed to the client at $30 to $50, because the partner is covering recruiting, payroll, benefits, management, and margin on top of the wage.
How we built these numbers
There is no single public report that cleanly separates what offshore developers earn from what agencies charge by country. The one authoritative rate guide is paywalled, and most of the free “rates by country” tables online cite nothing. So here’s our methodology, in the open. The earnings figures come from developer salary data: Levels.fyi country pages filtered to senior, Poland’s Bulldogjob 2025 IT survey, Ukraine’s DOU 2025/26 survey, and the 2025 Stack Overflow Developer Survey. The billing ranges come from Clutch’s 2026 pricing-by-location data plus the documented IT-staffing markup of roughly 30 to 50 percent over a developer’s pay, applied to the earnings figures. And they’re grounded in what Full Scale actually pays and bills after seven years of hiring senior developers across these countries. The numbers are ranges, not precise per-vendor quotes, because that’s what the honest data supports.
Latin America rates
If your team works on US business hours and you need real-time collaboration, Latin America buys you something Asia can’t: a four to six hour time zone overlap. Argentina, Brazil, and Mexico are the destinations US companies look at most. Senior developers in the region earn roughly $25 to $50 an hour and get billed at $40 to $80, with Mexico near the top because of how tightly its time zone aligns with the US.
The trade-off is rate. LatAm billing runs 30 to 50 percent higher than the equivalent in the Philippines or India. If you’re picking offshore primarily on cost savings, LatAm probably isn’t the answer. If you’re picking on collaboration speed, it might be. See our deeper look at offshore versus nearshore tradeoffs for the full decision framework.
Eastern Europe rates
Eastern Europe used to be the default Western European hire. Then the war changed everything. Senior developers in Ukraine, Romania, and Poland earn roughly $30 to $55 an hour and bill at $40 to $90, with Poland at the top because of EU regulatory alignment and a deep technical-talent pipeline. Polish and Romanian developers are strong on complex backend work, security, and algorithm-heavy domains. Ukraine had a similar reputation pre-2022 and many of its developers have relocated since; we’d treat Russia and Belarus with geopolitical caution in 2026 regardless of how the rate looks on paper, which is why they’re off the table above.
Asia rates
Asia is where the rate math gets aggressive. It’s also where the communication failure rate is highest if you pick the wrong country. The Philippines, Vietnam, and India are the destinations Full Scale’s clients ask about most.
The Philippines is where Full Scale built our team. Senior developers there earn $20 to $30 an hour locally and bill at $30 to $50, with Full Scale’s published rate at $35, which is 70 to 80 percent below US senior rates. English fluency, cultural communication style, and a temperament for remote work are why we picked it. See what hiring Filipino developers looks like at Full Scale.
India has the largest offshore talent pool in the world. Earnings run a touch higher than the Philippines on average, but English fluency varies more than people realize, especially for senior developers. Vietnam is the fastest-growing offshore destination right now, with strong engineering schools and rates similar to the Philippines.
Rates Vary by City Within a Country
Country is the headline, but it isn’t the whole picture. The same pattern that makes a developer in Manila cost less than one in San Francisco shows up inside a country too, because cost of living changes from city to city.
In Poland, the gap between the priciest tech city and the cheapest runs about 74 percent. Kraków developers average the most, while smaller cities like Białystok and Rzeszów sit far below, per Bulldogjob’s 2025 survey. In India, developers in metros outside Bangalore run roughly 8 to 22 percent below it for equivalent roles, with Pune 15 to 25 percent lower, per kaam.work’s 2026 salary report. In the Philippines, Manila and Makati sit a notch above Cebu and Davao.
It’s the same force every time, and it’s the whole argument in our companion piece on why the cost to hire a software developer depends on their location: pay tracks the local cost of living, not the developer’s skill. Picking a lower-cost city inside a strong talent market is one of the quieter ways to get senior skill for less.
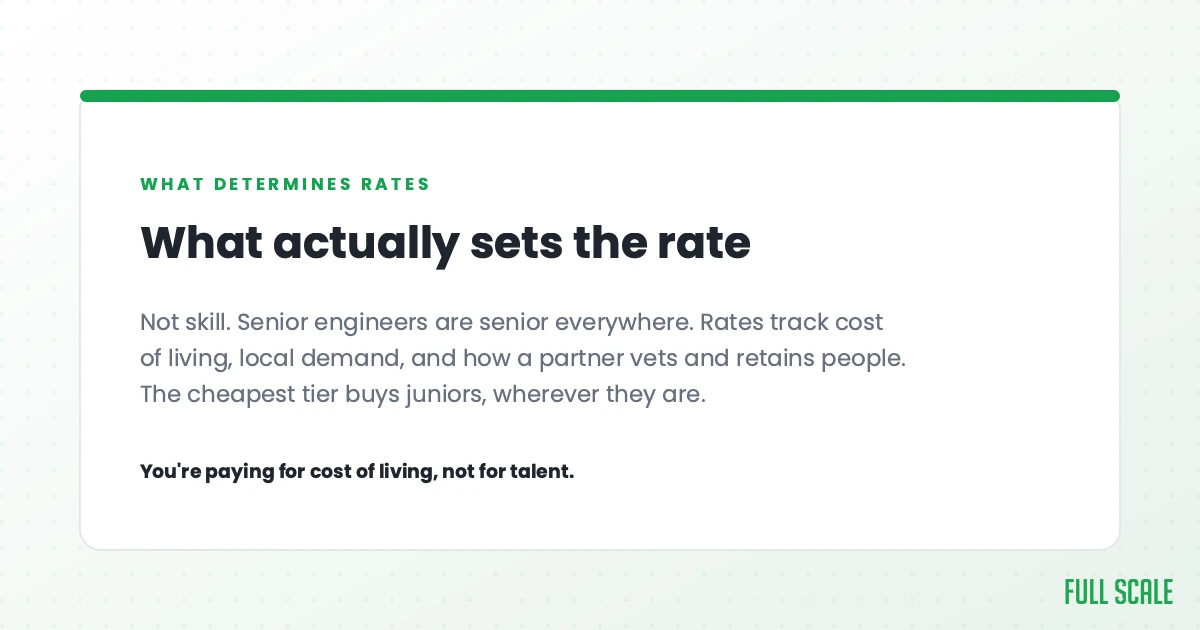
What Determines Offshore Developer Rates
Rates don’t bounce around because developers in some countries are better or worse. They bounce around because of cost of living more than anything else, plus currency, education and English fluency, and political stability. The cost of offshore software development always comes back to these levers, and the biggest one is the price of the life the salary has to cover.
Cost of living is the engine
A senior developer’s pay is priced against local prices, not American ones. On Numbeo’s 2025 cost-of-living index, the offshore countries above run roughly one-third to one-half of the US level, and rent is an even smaller fraction. A $30-an-hour senior wage in the Philippines is a strong professional income locally, even though the same number wouldn’t cover rent in a US tech hub. And the pay gap is wider than the lifestyle gap: Numbeo’s Local Purchasing Power Index puts Poland at about 62 percent of the US level even though Polish salaries are far below American ones. That tracks one of the most stable findings in economics, the Penn effect: price levels are systematically lower in lower-income countries, so wages and prices rise together as a country develops. (On whether offshore pay is fair, I cover that in the ethics of offshoring.)
Currency, education, and stability
Currency strength shifts your real budget: when the dollar is strong against the local currency, your hiring budget goes further, and Argentine peso volatility has produced some of the strangest offshore rate behavior of the last five years. Education depth and English fluency are not the same thing. India has world-class engineering programs but English fluency varies widely; the Philippines invested in both, which is part of why English fluency there is exceptional. And stability matters more than the rate on paper. Three years ago Ukraine was the default Eastern European hire; the math changed in 2022, and we don’t recommend new engagements in Russia or Belarus in 2026 regardless of the rate. The reliability of a long-term engagement depends on the country staying stable enough to ship code on time.
If you’re putting together a full cost picture, we’ve broken down how to reduce software development costs without burning out the team and what the real cost difference is between offshore and local hiring.
Why I Picked the Philippines for Full Scale
Every offshore rate post has to answer the question of which country to pick. For server-side work specifically, we broke down how much backend development costs. Most posts won’t commit to an answer, so I will: we built Full Scale in the Philippines for specific reasons, and after seven years and 350+ employees, those reasons have held up.
The teams we build for our clients feel like family. AMC Theatres is the best example I can point to. The developers we placed in the Philippines are treated as full AMC engineers, not as contractors. AMC’s Kansas City team flew to our Cebu City office for in-person time with the engineers, including karaoke, the beach, and exploring the city together. There’s no middleman in between, and the devs care about the product the same way the in-house engineers do. That is what makes building an offshore team actually work, and I give Filipino engineers most of the credit for why Full Scale has been as successful as it has.
English fluency and cultural communication
There’s no language barrier with Filipino engineers. The Philippines is one of the largest English-speaking countries in the world, and English is taught from grade school. Most senior Filipino developers can read American technical writing, joke around with American teams, and push back on requirements in fluent English. That last one matters more than people realize.
There’s a reason Filipinos dominate hospitality jobs around the world. The same cultural traits (friendliness, attentiveness, wanting to make people happy) translate directly to remote engineering work. Engineers we’ve placed at Full Scale show up for their teams the same way the best hospitality workers show up for their guests. That’s the kind of person you want building your product.
The Full Scale numbers
Some specifics. Full Scale has 350+ employees in the Philippines. Our developer retention is over 93 percent, which is rare in the industry. Our senior developers average 7+ years of experience. We’ve served over 200 tech companies, with 80+ active clients today.
Our published rate is $35 an hour, fully loaded. That’s roughly 70 to 80 percent below the equivalent US senior cost, and it buys a senior developer paid at the top of their local market, which is how you attract and keep the best people in any city.
The LendingStandard story
LendingStandard is one of our longest-running clients. They process roughly 30 percent of affordable multifamily property loans nationwide. Here’s what their CEO Andy Kallenbach said about working with our team:
Waking up each morning to collaborate with the Full Scale team has become the highlight of my day. Their work ethic, pride in craftsmanship, and the sheer quality of their output have not only met but exceeded our expectations. The most significant impact has been the seamless integration of their team with ours, making every challenge surmountable and every success sweeter.
Andy came to us after local hiring stalled, and he now has a Philippines team that’s an indistinguishable part of his company. Read the full LendingStandard case study.
Companies like Full Scale create real opportunities for people in places where those opportunities don’t otherwise exist. What people need more than anything is a shot. I’m proud we get to give them one. We call it a win-win-win: a win for our employees, a win for our clients, and that makes it a win for us.
One client put the cost math more plainly than any rate table can. Jason Flowers at AG Mednet had been paying nearshore rates in Brazil before he moved his QA to the Philippines:
For the same cost as one developer nearshore in Brazil, I can get two QA people at Full Scale.
Jason Flowers, Head of Software Engineering and DevOps at AG Mednet, on working with Full Scale
How to Pick the Right Offshore Country for Your Team
If you take one thing from this guide, take this: pick the country last, not first. Pick communication first, cost of living second, and let the country fall out of those two filters.
Start with communication. Can the team you’d hire actually communicate with yours? English fluency, cultural willingness to speak up when they don’t understand something, and comfort interacting directly with American product owners. If any of those three fail, the engagement is going to struggle no matter how cheap the rate is.
I’ve talked to founders running teams in other countries where they’ve only ever spoken to one person, the technical project manager, while every other developer hides behind that person. Sometimes it’s a language gap, sometimes it’s a cultural rule about who talks to the client. Either way, you end up with a team you can’t actually communicate with, and a middleman in the way of every decision. AI has changed this faster than anything else in my career, but the underlying problem hasn’t gone away. Here’s how to find an offshore partner who avoids that pattern.
Then look at cost of living. Once communication is locked, look at what the rate buys in the offshore country. A rate that builds a career for the developer also builds retention. The rate-cutting race-to-the-bottom that some offshore firms run produces developers who leave at the first opportunity, which is the worst possible thing for the long-term team you’re trying to build. For the full ROI math, our offshore cost analysis breaks down the numbers.
Country comes last. It’s the output of the first two filters, and most companies do this backward. It’s one of the quieter traps in recruiting offshore developers. They pick the cheapest country, then discover six months in that the team they hired can’t talk to their product manager and won’t push back on a bad spec. If you’re earlier in the decision process, our guide to the signs it’s time to offshore is the right starting point. And for staff augmentation pricing specifically, we’ve written a deeper guide.

Compare the Philippines to Specific Offshore Destinations
Most readers picking an offshore destination are weighing the Philippines against a specific alternative. Here’s how the Philippines stacks up head-to-head against the destinations our clients ask about most.
For Latin America comparisons, see our writeups on Philippines vs Argentina for offshore developers, how the Philippines compares to Uruguay, and Brazil vs the Philippines for offshore software development. And for the broader region, see the Philippines versus Latin America as a whole.
For Eastern Europe comparisons, we’ve written on Ukraine vs the Philippines for software outsourcing, Romania vs the Philippines, and how the Philippines compares on technical depth and English fluency.
For Asia comparisons, Philippines vs India and Philippines vs Vietnam for offshore developers are the head-to-heads our clients ask about most.
For broader context on which countries we’d recommend for offshore work, see our overview of the best countries to outsource software development.
Frequently Asked Questions About Offshore Software Development Rates
What is the average hourly rate for offshore software developers?
Senior offshore developers earn roughly $20 to $55 an hour locally and get billed to US clients at roughly $30 to $90 an hour, depending on country. In the Philippines, senior developers earn $20 to $30 and Full Scale bills $35. Eastern Europe and nearshore Latin America sit at the higher end. The gap between what a developer earns and what you’re billed covers the partner’s overhead and margin, and the country-to-country spread comes down to cost of living.
Which country is best for offshore software development?
The “best” country depends on what you optimize for. The Philippines wins on English fluency and communication for American teams. Eastern European countries like Poland and Romania win on technical depth at premium rates. Mexico and Brazil win on time zone overlap with US working hours. Pick communication first, cost second, country third.
What is the cheapest country to outsource software development?
Among senior talent, the Philippines, Vietnam, and India offer the lowest billing rates, roughly $30 to $55 an hour. But the cheapest hourly rate is rarely the cheapest total project cost. Communication failures, rework, and management overhead can easily double a cheap project’s real cost. Match cost to communication quality before optimizing for rate alone.
How do you calculate offshore software development cost?
Add the agency billing rate, communication and tooling overhead (typically 10 to 15 percent of base), and the management time you’ll need on your side. For a senior Philippines developer billed at $35 per hour, the all-in cost runs roughly $40 to $45 per hour including your team’s coordination time. Our offshore development cost analysis goes deeper if you want to model your own project.
Is offshore software development worth it?
It depends on whether you can communicate with the team. Companies that hire offshore developers as members of their own team, not as a contracted block, see a 50 to 70 percent reduction in offshore software development cost with no quality loss. Companies that hand work over to a project manager and never talk to the developers themselves get exactly what they pay for.
Why is the Philippines popular for software outsourcing?
English fluency, cultural alignment with American working style, friendly remote-collaboration temperament, and cost-of-living rates that make $20 to $30 an hour a strong local wage. Full Scale built our business in the Philippines for these reasons, and 350+ employees later, the bet has held up.
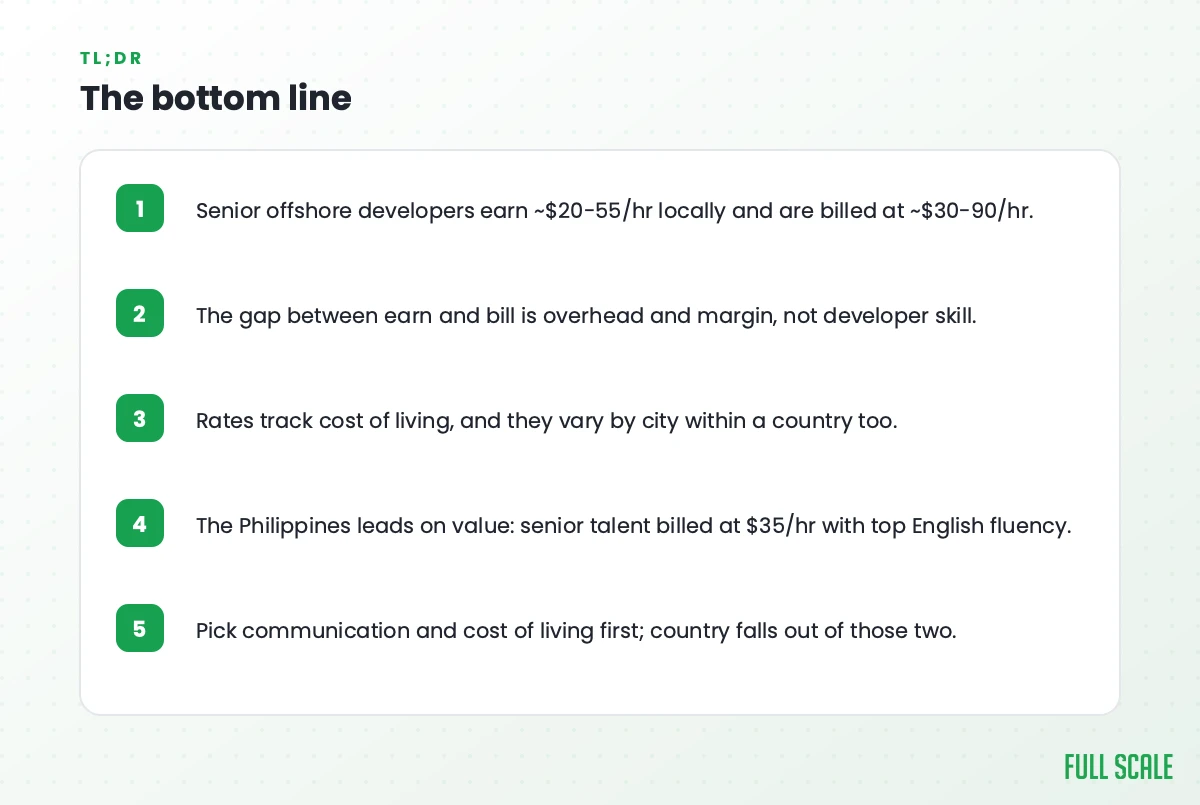
The Bottom Line
Picking a country is way less important than picking a team you can build a family with to own your product and your engineering. Full Scale has been family to over 200 clients.