How to Reduce Software Development Costs in 2026
In this article
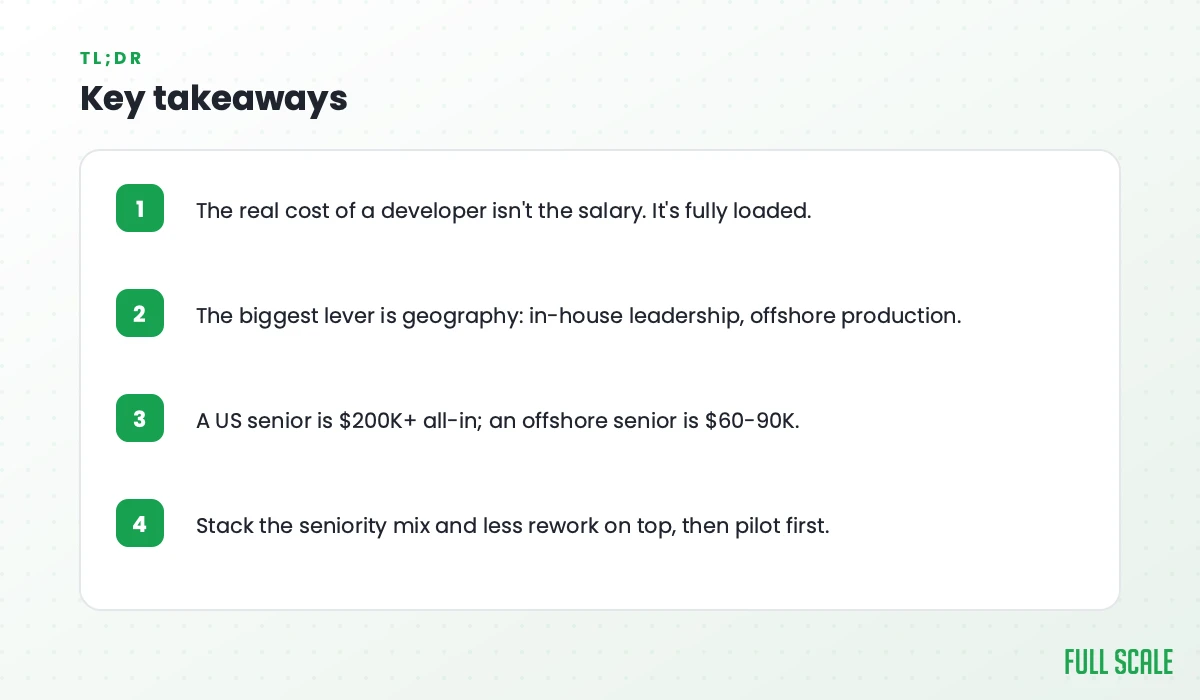
- The real cost of a developer is not the salary
- Why the hourly rate is the wrong thing to optimize
- The biggest lever: in-house leadership, offshore production
- The math, side by side
- Stack these on top of geography
- Making the case to your CFO
- What this looks like in practice
- Why teams run this play with Full Scale
- Start with a pilot
- Frequently Asked Questions
Your CFO asks the question every CFO asks heading into a budget cycle: can we spend less on engineering next year without shipping less?
The answer is yes. Most teams just go after it the wrong way. They hunt for a cheaper hourly rate, squeeze QA, or hand the work to the lowest bidder, and six months later they are paying more in rework and turnover. One of the biggest levers is where you hire, because a developer’s cost is mostly set by their location.
The cost that actually moves the needle is where the work happens, and how much overhead you carry to keep a seat filled. Cloud bills are one of the biggest hidden costs here, which is why cloud transformation services matter less than having engineers who manage the spend.
This is a practical guide to reducing software development costs in 2026 without cutting quality. The short version of the recommendation: keep your senior leadership and product ownership in-house, and move your production capacity to an offshore team you manage directly. Full Scale runs that model every day, and the math behind it is the whole point of this article.
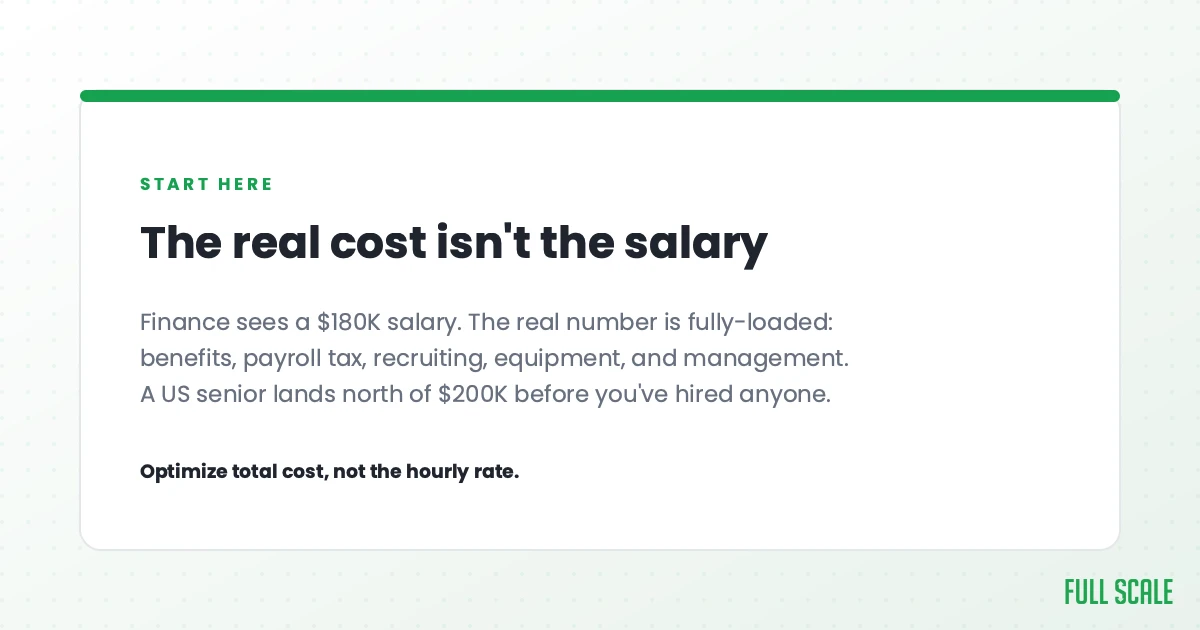
The real cost of a developer is not the salary
Most teams look at a developer’s salary and call that the cost. That’s like buying a car and budgeting only for the sticker price, not the insurance, gas, and maintenance you’ll pay for years.
Your finance team sees “senior developer, $180K.” Here’s what that hire actually costs once you load everything onto it.
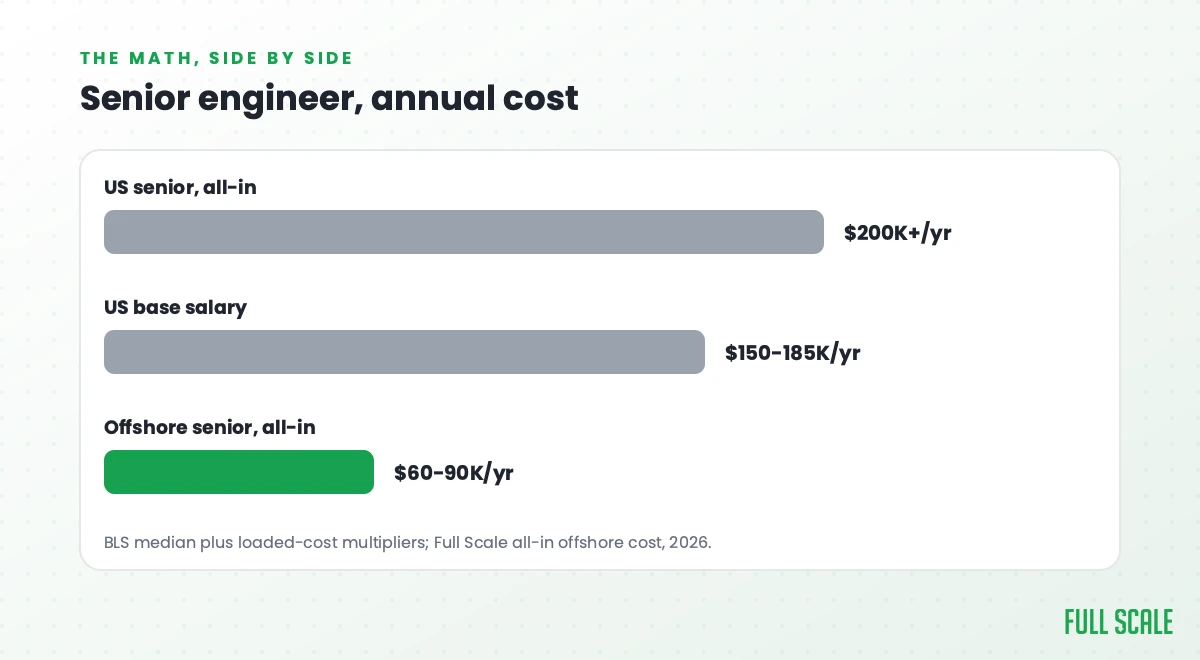
Start with base pay. The U.S. Bureau of Labor Statistics puts the median software developer salary around $133,000, with senior engineers landing roughly $150,000 to $185,000. Then apply the standard fully-loaded multiplier. MIT’s widely-used employee cost model puts true cost at 1.25 to 1.4 times base once you add benefits, payroll taxes, equipment, and overhead. A senior engineer lands north of $200,000 all in before you’ve recruited anyone.
Now add the costs finance never books against that role:
| Cost element | Annual amount |
|---|---|
| Base salary (senior) | $150,000–$185,000 |
| Bonus, equity, and benefits (loaded) | $60,000–$90,000 |
| Workspace, equipment, software licenses | ~$17,000 |
| Recruiter fee (20–25% of first-year salary) | $36,000–$46,000 |
| Onboarding and ramp (first 3 months at reduced output) | ~$55,000 |
| Turnover risk, amortized | ~$28,000 |
| True annual cost, one senior developer | ~$405,000 |
That $180K salary is really about $405,000 a year once you carry the full weight of it. This is my own number, built from running payroll and benefits across Full Scale, VinSolutions, and Stackify, not a figure I pulled off an analyst slide. The pieces are sourced; the all-in total is what I’ve actually paid.
And that’s the cost when the seat is filled.
The hidden tax: being perpetually understaffed
Here’s the cost nobody puts in the budget. The average senior engineering search in the U.S. drags on for months. While you’re recruiting, the work piles onto the people you already have.
So you’re paying for a four-person team and getting the output of three. The recruiter fee, the months of lost velocity, the burnout on the people covering the gap. None of it shows up as a line item, but all of it shows up in your roadmap slipping.
Why the hourly rate is the wrong thing to optimize
When teams set out to cut costs, they fixate on the rate. We unpack why that backfires with backend development cost in particular. Find a $25/hour developer instead of a $75/hour one and you’ve cut costs by two-thirds, right?
Almost never. The rate tells you what you pay per hour. It tells you nothing about how many hours it takes, how much gets thrown away, or how long that person stays.
The number that matters is cost per unit of shipped, working software. A cheaper developer who needs three times the rework, ships half the throughput, and quits in eight months is more expensive than a senior engineer at twice the rate. I call this cheapshoring: chasing the lowest sticker price and paying for it later in defects, churn, and management overhead. It’s the single most common way teams try to cut costs and end up raising them.
So the goal is more senior capacity per dollar, with the quality and stability that keep that dollar from leaking back out.
There’s exactly one lever that does that at scale.
The biggest lever: in-house leadership, offshore production
The most reliable way to cut your build cost in half without cutting quality is to change where the work happens, not who does it.
Roughly nine out of ten software developers live outside the United States. The U.S. is the single largest market for engineers, but it’s still only about one in ten of the world’s developers. The talent is global. The salaries are not, because they track local cost of living.
A senior engineer in the Philippines earns roughly $15 to $30 an hour. A senior engineer in the U.S. costs $80 to $150 an hour fully loaded. That gap is cost of living, not capability. Hiring globally lets you access the same caliber of engineer for 50 to 80 percent less than U.S. rates. That’s the lever. Everything else in this article is rounding error by comparison. I broke down what software engineers in the Philippines actually earn separately, because the public salary surveys get the picture wrong.
But “move everything offshore” is the wrong instruction, and it’s why some offshore engagements fail. The model that actually works is a split:
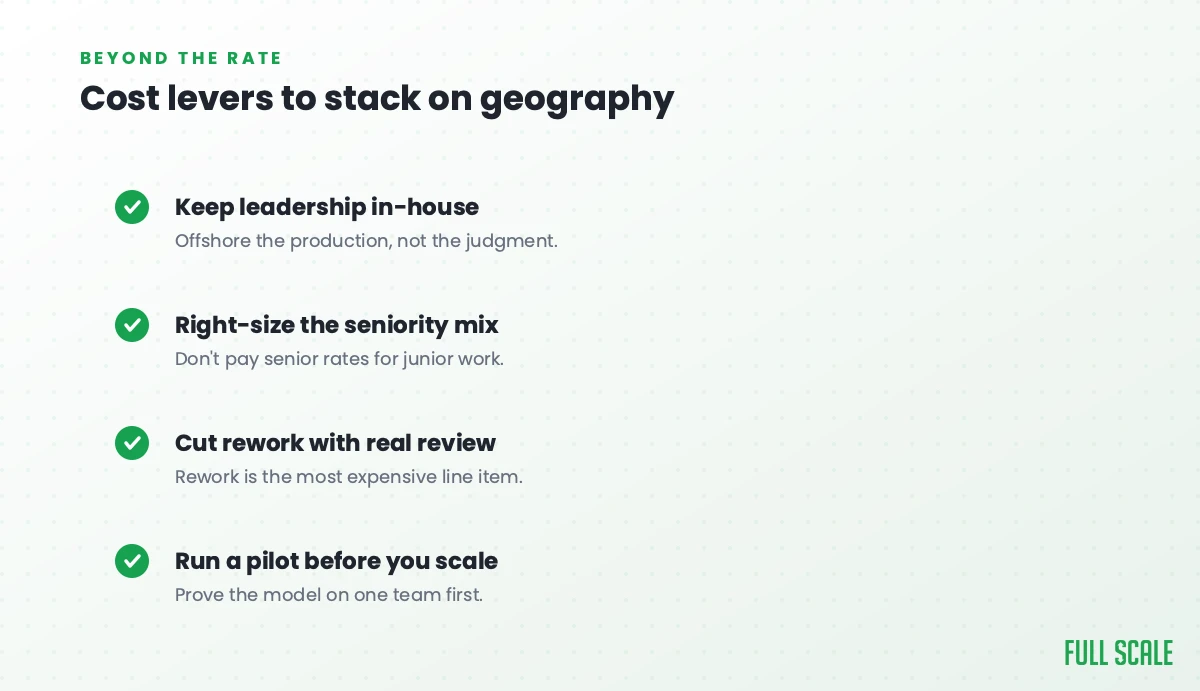
Keep in-house: the senior leadership and the decisions. Your architects, your tech leads, your product owners, the people who hold the domain knowledge and own what gets built and why. This is where judgment lives, and judgment shouldn’t be the thing you outsource.
Move offshore: the production capacity. Feature teams, QA, specialized skills, and the ability to scale the team up or down. This is the bulk of your engineering spend, and it’s where geography arbitrage does its work.
This is offshore staff augmentation: you keep control, your leadership, and your processes, and you add senior engineers who work inside your Slack, your standups, and your sprints as part of your team. Not a vendor you throw a spec over the wall to. Your team, in a lower-cost location, reporting to your leads.
The reason this beats hiring offshore developers directly is everything that sits around the engineer. A good partner runs the recruiting, the payroll, the local benefits, and the retention so you don’t carry that overhead or that risk. At Full Scale, in-house recruiters spend their time pulling passive senior candidates, the ones who already have jobs and would never answer a job post, off other companies’ teams. That’s the part most teams underestimate when they try to do it themselves.
The math, side by side
Take a four-person production team as the unit. Here’s the all-in annual cost both ways.
| All in-house | Offshore staff aug | |
|---|---|---|
| 4 senior developers, all in | ~$1,620,000 | ~$288,000 |
| What’s included | salary, benefits, recruiter fees, ramp, turnover | monthly rate, fully loaded, no extra fees |
| Time to fill a seat | months | weeks |
| Annual savings | ~$1.33M, about 80% |
Offshore staff augmentation runs about $4,800 to $6,600 per developer per month, fully loaded, which is roughly $30 to $40 an hour. That means no benefits, no payroll taxes, no office, no recruiter fee, and no four-month gap waiting on the next hire. The in-house figure already carries all of that overhead, which is why the gap is so wide.
The raw spread is more than 80 percent. I quote it conservatively at up to 70 percent, because in a real hybrid setup you’re still paying U.S. salaries for the leadership you keep in-house, and there’s always some coordination overhead. Even after that, the savings are enormous.
For most teams the smarter move is to reinvest the savings rather than pocket them: keep the same budget, and double your production capacity. Same $2M, twice the team, fully staffed.
Stack these on top of geography
Geography is the big lever. These are the rest, and they compound.
Let AI do the typing. As of 2026, about 75 percent of new code at Google is AI-generated, with every line still reviewed and approved by an engineer. I tell clients, half-jokingly, that we’re all paying developers to babysit AI now: review what it generates, catch what it gets wrong, and steer it toward something useful. That’s not a threat to the offshore argument, it strengthens it. When the code itself gets cheaper to produce, the value shifts to product judgment, and the cost of raw capacity should fall with it. The catch is that not every engineer is AI-fluent yet. We built an internal training program, the Spartan Training Academy, specifically so our engineers don’t fall behind on AI tooling, because a developer who can’t drive AI in 2026 is a developer who costs you more per feature.
Cut scope before you cut anything else. The cheapest feature is the one you don’t build. Roughly half of the features in most products are rarely or never used. Ruthless MVP discipline and real priorities save more money than any rate negotiation. This is the heart of the Product Driven approach: build what moves the business, kill the rest.
Fix the spec to kill rework. A defect caught in requirements is cheap. The same defect caught in production can cost a hundred times more. Time spent on discovery and a clear spec pays itself back several times over in avoided rework.
Pay down technical debt on a schedule. Carrying technical debt is a tax on every future sprint. Allocating part of each sprint to it keeps long-term maintenance costs from compounding.
Audit tooling and licenses. Open-source alternatives and a quarterly review of what you’re actually paying for usually recover a few percent of spend that’s quietly leaking.
Each of these saves you single-digit to mid-double-digit percentages. Geography saves you 50 to 70. Real software development cost optimization is stacking them: move the bulk of production offshore, then layer AI, scope discipline, and process on top. Do all of them.
Making the case to your CFO
Finance approves output and risk control. Frame it that way.
Don’t open with “I want to hire offshore developers to save money.” Open with the outcome: “Our engineering budget gets us four or five developers with constant turnover. I’ve found a way to get a senior in-house lead plus a full offshore squad, fully staffed, for the same money. Here’s the math.”
Then walk the comparison: same budget, roughly double the shipping capacity, recruiter fees gone, and seats that fill in weeks instead of months.
Address quality head-on, because it’s the first question. Quality comes from hiring standards. A good partner hires senior, integrates the engineers directly into your team, holds 90-plus percent retention, and works month-to-month so you can adjust if a fit isn’t right. You keep control of the work, not them.
And propose a pilot instead of a leap. Start with two developers for one quarter. The cost is small, the downside is capped, and you’ll know inside ninety days whether to scale. If it works, you expand. If it doesn’t, you’ve spent a fraction of a single U.S. hire to find out.
What this looks like in practice
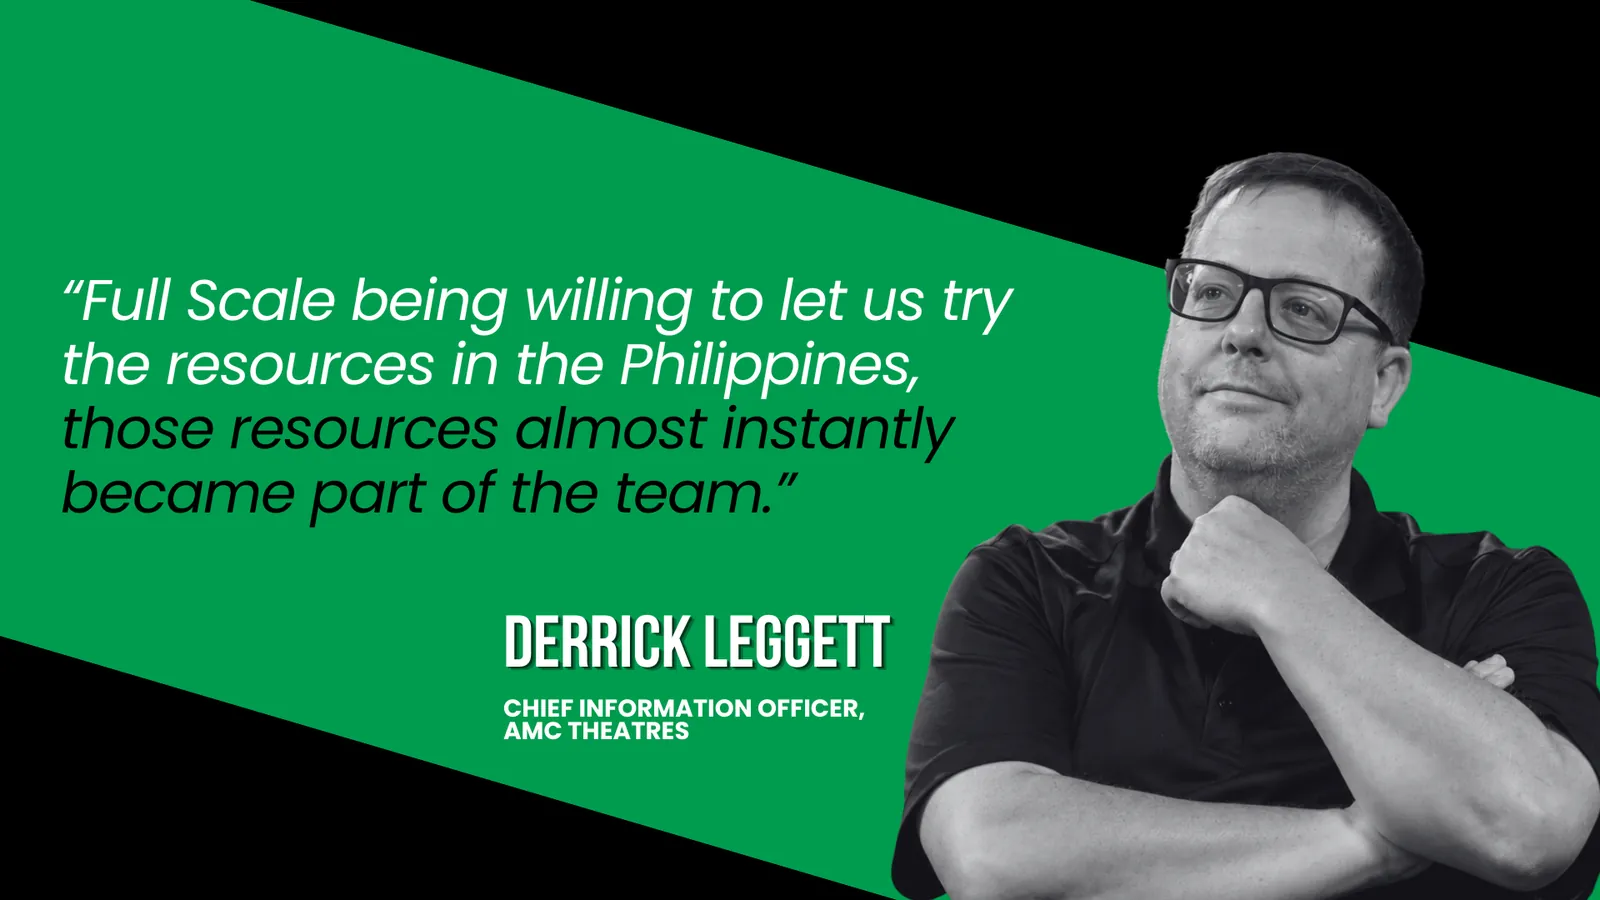
The model isn’t theoretical. AMC Theatres ran Full Scale engineers as one integrated team alongside their in-house staff, in their tools and their standups, not as an arm’s-length vendor. Their engineering lead, Derrick Leggett, has described the working relationship as one team rather than a client and a contractor.
The pattern repeats across teams that get this right. They keep their architects and product owners in-house, stand up an offshore squad for the build, and end up with more capacity than they could afford domestically, at a cost their CFO signs off on without a fight. The savings are real because the overhead, the recruiting, the benefits, the turnover, moves off their books.
Why teams run this play with Full Scale
We’ve helped over 200 tech companies build engineering teams this way. What makes the model work:
- $4,800–$6,600 per developer per month, fully loaded, with transparent pricing and no recruiter fees or benefits stacked on top.
- 93% developer retention. Our team stays for years, which means your team stays for years. For context, we’re Great Place to Work Certified in the Philippines two years running, with 95% of employees saying it’s a great place to work versus 65% at a typical company.
- Senior engineers in weeks, not months. Pre-vetted candidates, with in-house recruiters who pull passive senior talent off other teams.
- Direct integration. Your Slack, your standups, your processes. Your team, our payroll.
- Month-to-month flexibility. Scale up or down with 30 days’ notice. No lock-in.
- U.S.-based contracts. All IP protection sits under U.S. law.
- 350+ engineers across major stacks, all going through ongoing AI training so they stay ahead of the tooling.
We don’t place developers and walk away. We become the production half of your engineering org while you keep the leadership and the product decisions where they belong, in-house.
Start with a pilot
Your CFO asked whether you can spend less on engineering next year. You can, and not by a little. The lever isn’t a cheaper rate, it’s keeping your leadership in-house and moving your production capacity to a senior offshore team you manage directly.
Done right, that cuts your build cost by 50 to 70 percent without touching quality, or doubles your capacity for the same budget. Start with a two-developer pilot, prove it in a quarter, and scale from there.
Schedule a call and we’ll build the business case with your real numbers.
Frequently Asked Questions
How much can I realistically save by moving development offshore?
Most teams save 50 to 70 percent on the production half of their engineering spend. The exact figure depends on how much you keep in-house, your current overhead, and your team size. The savings come from cost-of-living arbitrage on senior talent, plus eliminated recruiter fees, benefits, and turnover.
Won’t offshore developers compromise code quality?
This is the first question every team asks. Quality depends on hiring standards, not geography. The failure mode is cheapshoring, chasing the lowest rate and getting junior developers who need constant rework. Hire senior, integrate them into your team, and quality holds. Our 93% retention exists because we hire senior and treat people well. The 2026 version of that failure mode is replacing developers with AI agents to cut the bill, which trades a salary for a cleanup project.
Should I move my whole team offshore?
No. The model that works keeps senior leadership, architecture, and product ownership in-house, and moves production capacity, feature teams, QA, and scaling, offshore. You keep judgment and control where it belongs and get cost savings where the spend actually is.
How fast can offshore developers start?
Weeks, not months. Pre-vetted senior candidates can be in front of you within a week or two and working in your standups shortly after, compared to the multi-month cycle of a typical U.S. senior hire.
Can I mix in-house and offshore developers?
That’s exactly the recommended model. Keep your architects, tech leads, and domain experts in-house. Add offshore engineers for feature work, specialized skills, and scaling capacity. You get stability where you need it and flexibility where it matters, at a fraction of the all-in cost.