Developer Attrition Reduction: How Our Clients Achieved 60% Improvement in 6 Months
Developer attrition represents a critical business risk in today’s competitive tech landscape.
According to a 2024 Stack Overflow Developer Survey, the industry faces an alarming 23% average turnover rate among software engineers.
This silent productivity killer costs organizations an estimated 1.5–2x annual salary per departing developer, as reported by the Society for Human Resource Management.
Our client, a mid-size FinTech firm, faced this challenge head-on. Their engineering team was hemorrhaging talent at a staggering 35% annual rate. After implementing our structured developer attrition reduction framework, they achieved remarkable results.
Key highlights of their transformation:
- 60% reduction in developer turnover within six months
- 121% improvement in projected average tenure
- 86% increase in career growth satisfaction scores
- 41% higher technical challenge engagement ratings
This significant improvement wasn’t accidental. It resulted from a systematic, data-driven approach to retention.
Understanding the Developer Attrition Crisis
The developer attrition crisis requires context to fully grasp its implications for modern tech companies.
According to the 2024 LinkedIn Workforce Report, high-growth companies experience attrition rates up to 35% higher than industry averages. This pattern creates a dangerous cycle where companies most needing stability face the greatest retention challenges.
The following table highlights the financial impact of developer turnover across different seniority levels. These figures demonstrate why systematic developer attrition reduction should be a strategic priority for technical organizations.
| Developer Level | Direct Replacement Cost | Productivity Loss | Knowledge Transfer Loss | Total Impact |
| Junior | $25,000-40,000 | 2-3 months | 10-15% team impact | $40,000-65,000 |
| Mid-level | $50,000-85,000 | 3-6 months | 15-25% team impact | $85,000-150,000 |
| Senior | $95,000-150,000 | 6-9 months | 25-40% team impact | $160,000-300,000 |
These costs represent conservative estimates based on industry research from Robert Half Technology and the DevOps Research Association (DORA). Actual impacts vary based on team size, technical complexity, and market conditions.
Developer turnover generates substantial financial consequences that extend far beyond immediate hiring costs:
- Recruitment Costs: $50,000-85,000 per mid-level developer
- Productivity Loss: 3-6 months at reduced capacity during transitions
- Knowledge Transfer Challenges: 40-60% of critical process details are lost with departures
The cultural impacts spread throughout the organization, creating what Harvard Business Review terms “attrition contagion.” Each departure increases the likelihood of additional exits by 9-13%.
Case Study: The 60% Reduction Journey
Our client operated in the competitive FinTech sector with approximately 200 employees and an engineering department of 65 developers.
Initial assessment revealed troubling metrics across their technical teams. Their developer retention metrics significantly underperformed industry standards.
The assessment uncovered the following baseline metrics:
| Retention Metric | Initial State | Industry Benchmark | Variance |
| Annual developer turnover | 35% | 23% | +52% |
| Average tenure | 1.4 years | 2.8 years | -50% |
| Employee satisfaction (career growth) | 4.2/10 | 7.3/10 | -42% |
| Knowledge transfer effectiveness | 4.3/10 | 7.8/10 | -45% |
These figures came from our comprehensive assessment protocol that combines HRIS data analysis, structured interviews, and employee surveys.
The metrics revealed significant opportunities for developer attrition reduction initiatives. Exit interview analysis revealed four primary departure drivers:
- Limited growth opportunities (68% of departures)
- Insufficient technical challenges (53%)
- Management communication issues (47%)
- Compensation concerns (42%)
Based on this assessment, we developed a phased implementation plan targeting these specific retention factors.
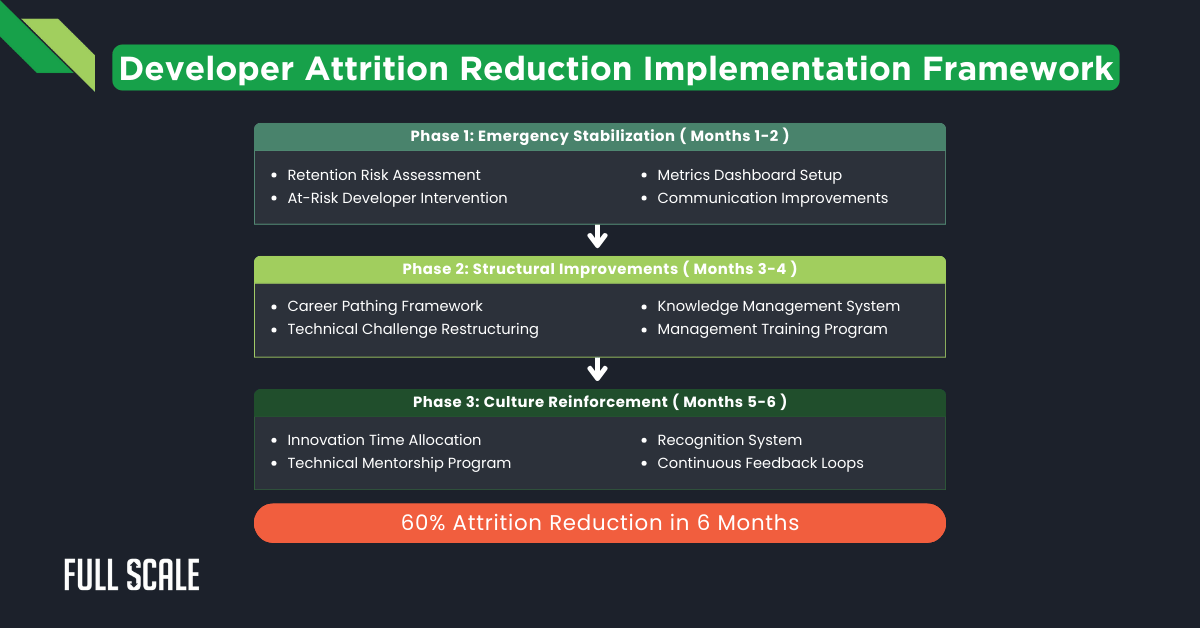
This implementation framework guided our three-phase approach to developer retention. Each phase built upon the previous one to create sustainable improvement in key retention metrics.
Implementation Strategy
The implementation roadmap proceeded through three distinct phases:
Phase 1: Emergency Stabilization (Months 1-2)
- Conducted a comprehensive retention risk assessment
- Implemented “at-risk” developer intervention program
- Established a retention metrics dashboard
Phase 2: Structural Improvements (Months 3-4)
- Deployed career pathing framework
- Restructured technical challenge allocation
- Implemented a formal knowledge management system
Phase 3: Culture Reinforcement (Months 5-6)
- Established innovation time allocation
- Created a technical mentorship program
- Deployed recognition and celebration rituals
Key Intervention Strategies
Our implementation focused on five core intervention strategies derived from our developer retention framework.
Each strategy targeted specific retention factors identified in our initial assessment. These interventions were sequenced to build momentum through early wins.
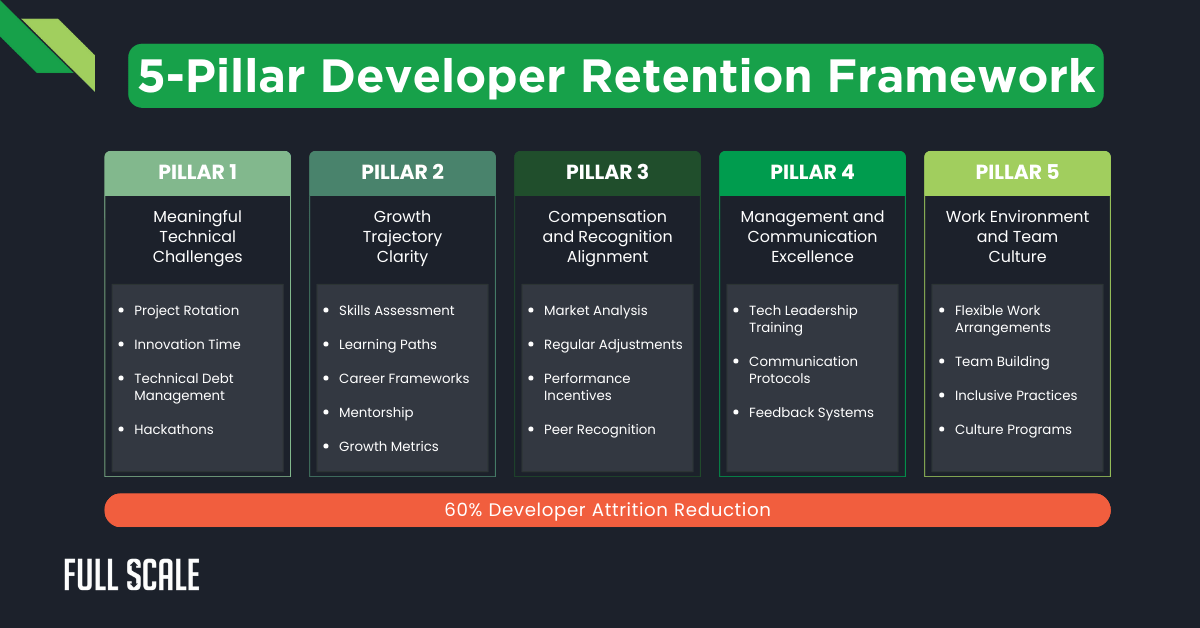
The five-pillar framework provides a comprehensive approach to developer attrition reduction. This systematic model addresses both tangible and intangible retention factors that influence developer decisions.
- Technical Challenge Enhancement: Implemented structured project rotation and established a technical innovation program allocating 15% of engineering time to creative exploration.
- Career Growth System: Deployed a comprehensive career growth framework with seven distinct engineering levels and tailored growth plans for each developer.
- Management Excellence: Technical managers completed an intensive leadership development program focusing on engineering-specific challenges.
- Knowledge Management: Deployed a comprehensive knowledge system, including code documentation standards and cross-training protocols.
- Compensation Alignment: Revised compensation strategy with twice-yearly market rate adjustments and performance-based bonus structure.
Results
Six months after implementation, the client achieved remarkable improvements in all key metrics. The developer attrition reduction initiatives delivered measurable ROI through both direct cost savings and productivity enhancements.
- Annual developer turnover: reduced from 35% to 14% (-60%)
- Average tenure projection: increased from 1.4 to 3.1 years (+121%)
- Employee satisfaction with career growth: improved from 4.2/10 to 7.8/10 (+86%)
- Knowledge transfer effectiveness: improved from 4.3/10 to 8.1/10 (+88%)
The client established ongoing monitoring systems with monthly retention dashboards tracking leading indicators of potential attrition. Quarterly retention strategy reviews ensure continuous improvement in their developer experience.
Developer Attrition Reduction Framework
Our experience across multiple client engagements has refined our approach to developer retention. This comprehensive model addresses the primary drivers of turnover through five interconnected pillars.
Each pillar targets specific retention factors backed by industry research and practical implementation.
Pillar 1: Meaningful Technical Challenges
Developers thrive when tackling stimulating technical problems. According to a 2024 GitHub Developer Survey, absence of interesting challenges consistently ranks among the top three reasons engineers leave organizations. Technical challenge enhancement directly impacts developer engagement scores.
Effective strategies include:
- Strategic project rotation prevents technical stagnation
- Dedicated innovation time (typically 10-20% of working hours)
- Structured technical debt management with regular reduction sprints
Pillar 2: Growth Trajectory Clarity
Career advancement uncertainty drives significant developer attrition. Engineers seek clear progression paths connecting current responsibilities to future opportunities. Well-defined growth frameworks reduce anxiety about career development.
Key approaches include:
- Objective skills assessment frameworks with clear competency matrices
- Individualized development plans connecting daily work to career aspirations
- Formal mentorship programs accelerate growth while strengthening connections
Pillar 3: Compensation and Recognition Alignment
While rarely the primary departure driver, compensation misalignment accelerates attrition when combined with other factors.
Strategic approaches prevent compensation from becoming a departure catalyst. Regular market adjustments eliminate a common “final straw” in attrition decisions.
Effective strategies include:
- Proactive market monitoring with regular adjustment cycles
- Performance-based incentives reward knowledge sharing and technical excellence
- Non-monetary recognition fulfilling psychological needs beyond compensation
Pillar 4: Management and Communication Excellence
Direct manager relationship quality significantly influences retention decisions. A 2024 McKinsey study found that poor management regularly appears among the top three departure reasons.
Essential components include:
- Specialized management training addressing the unique challenges of technical leadership
- Structured communication protocols prevent isolation in distributed environments
- Robust feedback systems identify retention risks before departure decisions
Pillar 5: Work Environment and Team Culture
Environmental and cultural factors significantly influence retention decisions. According to Gallup’s 2024 State of the Workplace report, negative cultures accelerate departures even when other retention elements function effectively.
Effective approaches include:
- Flexible work arrangements accommodating diverse life circumstances
- Intentional connection activities prevent isolation in distributed environments
- Inclusive practices welcome diverse perspectives and communication styles
Developer Retention ROI Calculator
INPUTS
CALCULATION
2x Salary
Departures
Departures Prevented:
6.5 per year
Calculation Formula:
(Current Departures – Target Departures) × Cost per Departure
RESULTS
SAVINGS BREAKDOWN
Recruitment & replacement costs
Faster project delivery, reduced disruption
Preserved institutional knowledge and expertise
Implementation Guide: Starting Your Retention Transformation
Effective developer attrition reduction begins with an accurate diagnosis. Comprehensive assessment tools identify specific retention challenges requiring intervention:
- Retention Metrics Audit: Gather quantitative data across turnover statistics, tenure patterns, and departure drivers
- Developer Experience Survey: Deploy specialized measurement of technical engagement, growth perception, and management effectiveness
- Retention Risk Mapping: Identify high-impact departure risks and calculate attrition costs
After assessment, develop a balanced implementation portfolio including both immediate and structural interventions:
Quick Win Characteristics:
- Implementation timeline under 30 days
- Visible impact on developer experience
- Minimal approval requirements
- Addresses high-visibility pain points
Long-Term Initiative Characteristics:
- Addresses fundamental retention drivers
- Creates sustainable capability improvement
- Requires a phased implementation approach
- Delivers compounding benefits over time
Continuous measurement drives implementation accountability. An effective dashboard should monitor both leading indicators (engagement signals, productivity patterns) and lagging outcomes (turnover statistics, tenure improvement).
ROI Analysis: The Business Case for Developer Attrition Reduction
Comprehensive cost modeling quantifies the full financial impact of developer turnover. According to the DevOps Research and Assessment (DORA) State of DevOps 2024 report, the average fully-loaded cost of developer departure ranges from 1.5-2.5x annual salary.
Beyond direct replacement costs, developer attrition reduction generates substantial productivity benefits:
- Knowledge preservation: 3-6 weeks reduced ramp time per new hire
- Continuity improvement: 10-20% faster project delivery
- Collaboration efficiency: 5-15% time savings through stable teams
- Innovation increase: 10-30% more creative solution development
These productivity enhancements deliver ongoing operational benefits that compound over time as team stability increases.
Beyond Retention: Full Scale’s Developer Staff Augmentation Solutions
Implementing effective developer attrition reduction strategies requires specialized expertise and resources.
At Full Scale, we’ve developed a proven methodology that has helped clients reduce developer turnover by up to 60% within six months.
Our approach combines retention best practices with our core staff augmentation services. We don’t just help you retain your existing team—we provide skilled developers who integrate seamlessly with your organization.
Full Scale’s Comprehensive Developer Solutions
- Dedicated Development Teams: Our skilled developers become an extension of your team, bringing stability and expertise to your projects.
- Retention Consulting: We apply our proven 5-pillar framework to help identify and address the root causes of developer attrition.
- Technical Leadership Development: We train your engineering managers in the specialized skills needed to lead and retain technical teams.
- Knowledge Management Systems: We implement processes that preserve institutional knowledge even through team transitions.
- Flexible Scaling Options: Our staff augmentation model allows you to scale your team up or down based on project needs without recruitment challenges.
Don’t let developer attrition derail your technical initiatives. Partner with Full Scale to build a sustainable engineering organization with exceptional retention rates.
Transform Your Dev Team, We Know How
FAQs: Developer Attrition Reduction
What are the primary causes of high developer attrition rates?
High developer attrition typically stems from several key factors:
- Lack of challenging technical work
- Limited career growth opportunities
- Poor management relationships
- Inadequate compensation alignment
- Unsupportive work environment
According to GitHub’s 2024 Developer Survey, technical stagnation and unclear growth paths rank among the top reasons engineers seek new opportunities.
How long does it take to see results from developer attrition reduction initiatives?
Initial results from effective developer attrition reduction strategies appear within 2-3 months, with significant improvements by month 6. Organizations typically observe:
- Early indicators: Improved engagement metrics (1-2 months)
- Mid-term results: Reduced resignation notices (3-4 months)
- Full impact: Measured reduction in turnover rates (6 months)
The case study highlighted in this article showed a 60% reduction in engineering team retention issues within six months.
What ROI can companies expect from investing in tech talent retention?
Developer attrition reduction initiatives typically deliver 300-900% ROI over three years. Financial benefits come from:
- Direct cost savings: $85,000-150,000 per prevented mid-level developer departure
- Productivity improvements: 10-20% faster project delivery
- Knowledge preservation: 3-6 weeks reduced ramp time for new hires
Companies with 50+ developers often see seven-figure annual savings from halving their turnover rates.
How does remote work impact software engineer retention strategies?
Remote work has fundamentally changed software engineer retention strategies. Effective approaches now include:
- Structured communication protocols prevent isolation
- Intentional virtual team-building activities
- Clear work-from-home productivity expectations
- Digital-first knowledge management systems
- Equitable advancement opportunities regardless of location
Organizations must adapt their developer attrition reduction frameworks to address the unique challenges of distributed teams.
Which retention pillar typically delivers the fastest improvement?
The “Meaningful Technical Challenges” pillar typically delivers the fastest improvement in reducing developer turnover metrics. Quick-win initiatives include:
- Innovation time allocation (15-20% of working hours)
- Technical debt reduction sprints
- Project rotation opportunities
- Hackathons and innovation challenges
These initiatives address a primary developer satisfaction driver while demonstrating organizational commitment to technical excellence.
How does Full Scale’s staff augmentation model support developer retention?
Full Scale’s staff augmentation services enhance developer attrition reduction through our unique approach:
- We handle recruitment, reducing your team’s hiring burden
- Our developers integrate with your retention framework
- We provide technical leadership development for your managers
- Our knowledge management systems preserve critical information
- We offer flexible scaling options to optimize team workloads
Our comprehensive approach combines immediate staffing solutions with long-term retention strategies, addressing both symptoms and root causes of developer attrition.