A CFO s Guide to Predictable Development Spending with Sample Budget
Technology investments present unique financial challenges for today’s CFOs. Managing development spending effectively has become a critical competitive advantage in an era of tight budgets and rapid digital transformation. Recent studies highlight the growing importance of predictable development spending:
- 5% of IT projects exceed their budgets by an average of 27%, creating significant financial strain (McKinsey & Company, 2023)
- Unpredictable development costs directly impact quarterly financial performance (Harvard Business Review, 2024)
- Technical uncertainty transforms into tangible business risk as projects advance (Gartner Research, 2023)
- Organizations with structured budget frameworks show 23% higher development ROI (Deloitte Digital Transformation Survey, 2024)
This comprehensive guide presents frameworks for predictable development spending, providing finance leaders with practical tools for budget planning, resource allocation, and performance measurement.
Understanding the True Costs of Software Development
Understanding both visible and hidden development costs is essential for effective financial planning. Many organizations underestimate the total investment required when they focus only on obvious expenditures.
Software development costs extend far beyond developer salaries and licenses. Organizations need comprehensive software development budget planning to account for both visible and hidden expenses.
Visible costs include:
- Contracted rates and salaries
- Infrastructure expenses
- Licensing fees
- Hardware requirements
Hidden costs often account for 30-40% of total development spending:
- Onboarding time
- Knowledge transfer
- Technical debt accumulation
- Productivity fluctuations
The table below breaks down technical debt categories and their financial impacts. Each category requires specific mitigation strategies to reduce long-term costs and create substantial savings over multi-year development cycles.
| Technical Debt Category | Financial Impact | Mitigation Strategy |
| Code Quality Issues | 15-25% increased maintenance costs | Regular code reviews and refactoring |
| Outdated Dependencies | Security vulnerabilities, compliance risks | Dependency management program |
| Architecture Limitations | Scaling constraints, performance bottlenecks | Architecture review board |
| Documentation Gaps | Extended onboarding time, knowledge loss | Documentation requirements in sprint planning |
This comparison illustrates how technical debt creates measurable financial impacts. Organizations that implement technical debt management strategies typically show significantly improved development ROI over multi-year periods.
Different team structures present distinct financial considerations for organizations. The comparison below highlights key cost factors between in-house and distributed development models.
| Cost Factor | In-House Team | Distributed Team |
| Talent Acquisition | $15,000-$30,000 per hire | $5,000-$10,000 per placement |
| Salary & Benefits | $120,000-$180,000 per developer | $60,000-$90,000 per developer |
| Office & Equipment | $15,000-$25,000 per employee annually | Often included in the service fee |
| Scaling Costs | High (recruitment, onboarding, space) | Low (flexible contracts, rapid scaling) |
| Management Overhead | High (direct management required) | Moderate (shared management model) |
This cost comparison demonstrates potential savings with distributed teams while highlighting the full expense profile of each model. Many organizations implement hybrid approaches to optimize their cost structure.
Building a Predictable Development Budget Framework
Creating a structured budget framework provides the foundation for financial predictability. Effective models balance stability with the flexibility needed for changing business requirements.
A reliable development budget requires structured components and consistent measurement. Effective development spending frameworks distinguish between essential maintenance and strategic initiatives.
Key components of a predictable budget model include:
- Fixed vs. variable cost allocation
- Accurate development cost benchmarks
- Budget flexibility mechanisms
- Regular review cycles
The distribution between fixed and variable elements creates both stability and adaptability. Effective CFOs typically allocate 60-70% to fixed elements while keeping 30-40% flexible for changing priorities.
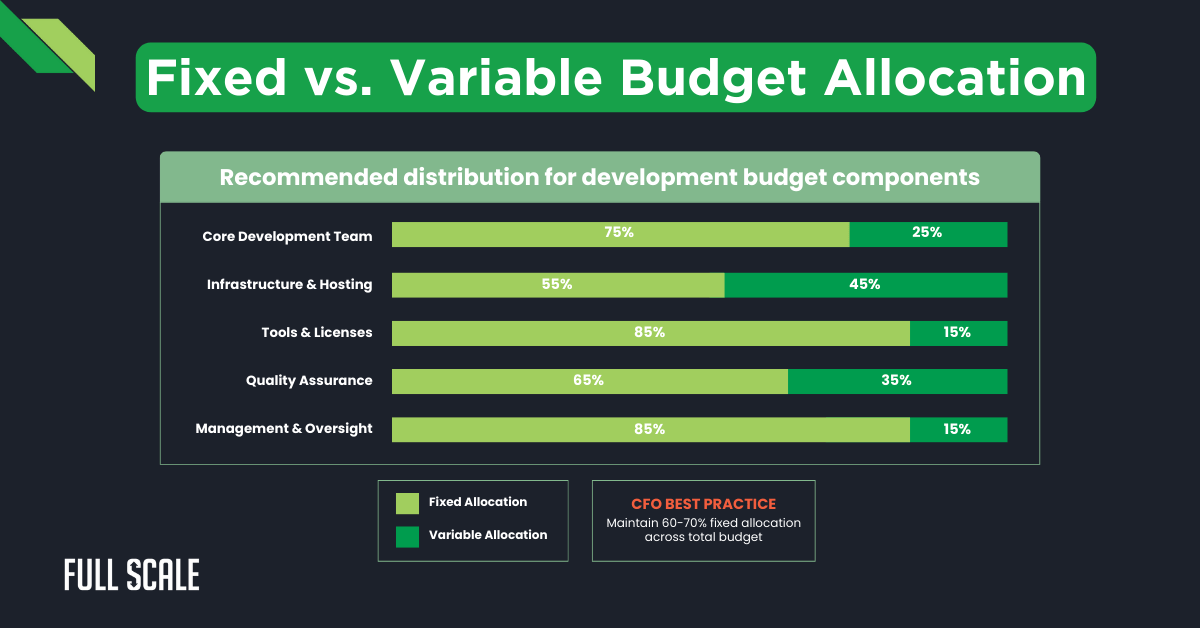
This diagram illustrates the optimal balance between fixed and variable allocation across major development budget categories. Fixed allocations provide stability while variable portions enable responsive adjustment to changing business priorities.
The table below outlines recommended allocation percentages across budget components. These guidelines help structure development budgets for both stability and flexibility.
| Budget Component | Fixed Allocation | Variable Allocation | Scaling Considerations |
| Core Development Team | 70-80% | 20-30% | Maintain core team stability with variable members for peaks |
| Infrastructure & Hosting | 50-60% | 40-50% | Base capacity fixed with elastic scaling for demand |
| Tools & Licenses | 80-90% | 10-20% | Essential tools fixed, specialty tools variable |
| Quality Assurance | 60-70% | 30-40% | Increase QA resources proportionally with development |
| Management & Oversight | 80-90% | 10-20% | Consistent management with additional oversight for growth |
This allocation table provides guidelines for structuring development budgets with appropriate fixed and variable components. The percentages represent industry benchmarks that organizations can adjust based on their specific development patterns.
Financial Strategies for Managing Development Team Scaling
Resource scaling presents significant challenges for budget predictability. Effective scaling strategies maintain financial control while providing the flexibility needed for changing project requirements.
Team scaling directly impacts development spending predictability. Different resource acquisition approaches present distinct financial profiles for organizations to consider in their IT budget forecasting.
Just-in-time resource allocation optimizes spending through precise timing:
- Minimizes idle capacity while maintaining delivery timelines
- Implements phased team expansion aligned with project stages
- Accounts for productivity variations during transitions
Staff augmentation offers significant financial advantages:
- Converts fixed employee costs into flexible operational expenses
- Reduces recruitment and onboarding expenses
- Minimizes unutilized capacity during project transitions
The following diagram illustrates different approaches to acquiring specialized technical skills. Each method presents distinct cost structures, timelines, and financial risk profiles.
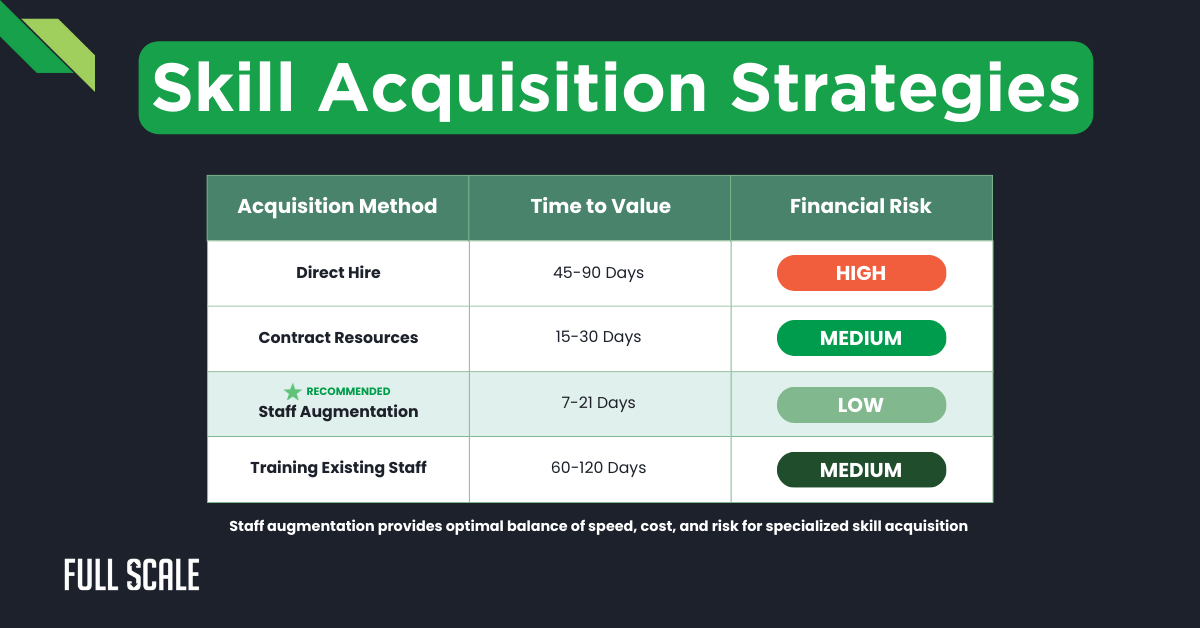
This comparison highlights how staff augmentation often provides the optimal balance of cost and flexibility when acquiring specialized skills. The right approach depends on specific skill requirements and organizational constraints.
The table below compares different approaches to specialized skill acquisition. These comparisons help finance leaders evaluate the optimal strategy for different skill requirements.
| Acquisition Method | Cost Structure | Time to Productivity | Financial Risk |
| Direct Hire | High (salary premium + benefits + recruitment) | 45-90 days | High (long-term commitment) |
| Contract Resources | Very High (premium hourly rates) | 15-30 days | Medium (limited term, high rates) |
| Staff Augmentation | Medium (standardized rates, no overhead) | 7-21 days | Low (flexible commitment) |
| Training Existing Staff | Medium (training costs + productivity loss) | 60-120 days | Medium (retention risk after training) |
This comparison demonstrates the financial implications of different skill acquisition strategies. Each approach offers distinct advantages depending on timeline requirements and budget constraints.
Technology Investment Prioritization: A Financial Perspective
Strategic investment prioritization ensures maximum returns from limited development resources. Effective frameworks balance immediate business needs with long-term platform sustainability.
Strategic investment allocation across development functions supports balanced development cost optimization. Effective prioritization frameworks evaluate both financial and technical factors.
Key investment categories include:
- Revenue-generating features (40-50%)
- Technical debt reduction (15-20%)
- Security and compliance (10-15%)
- Platform enhancements (10-15%)
- Innovation and exploration (5-10%)
- Maintenance and support (10-15%)
These allocation ranges represent industry benchmarks for technology organizations. Companies should adjust these allocations based on their specific strategic priorities and competitive landscape.
The build versus buy decision significantly impacts development finances. Custom development creates tailored solutions but requires substantial investment, while third-party solutions offer faster implementation with ongoing license costs.
| Decision Factor | Custom Development | Third-Party Solution |
| Initial Investment | Higher (full development costs) | Lower (license purchase or subscription) |
| Timeline to Value | Extended (complete development cycle) | Compressed (implementation focused) |
| Ongoing Maintenance | Internal resource requirement | Vendor managed with license fees |
| Customization Control | Complete flexibility | Limited to vendor capabilities |
| Competitive Advantage | Potential differentiation | Industry standard capabilities |
| Resource Requirements | Dedicated development team | Implementation and integration focus |
This comparison framework provides structure for comprehensive build vs. buy decisions. Finance leaders should collaborate with technical teams to analyze these factors based on specific business requirements.
Comprehensive Sample Budget Template
Practical implementation requires detailed budget structures that align with these frameworks. The following comprehensive template provides a starting point for finance leaders to implement predictable development spending models.
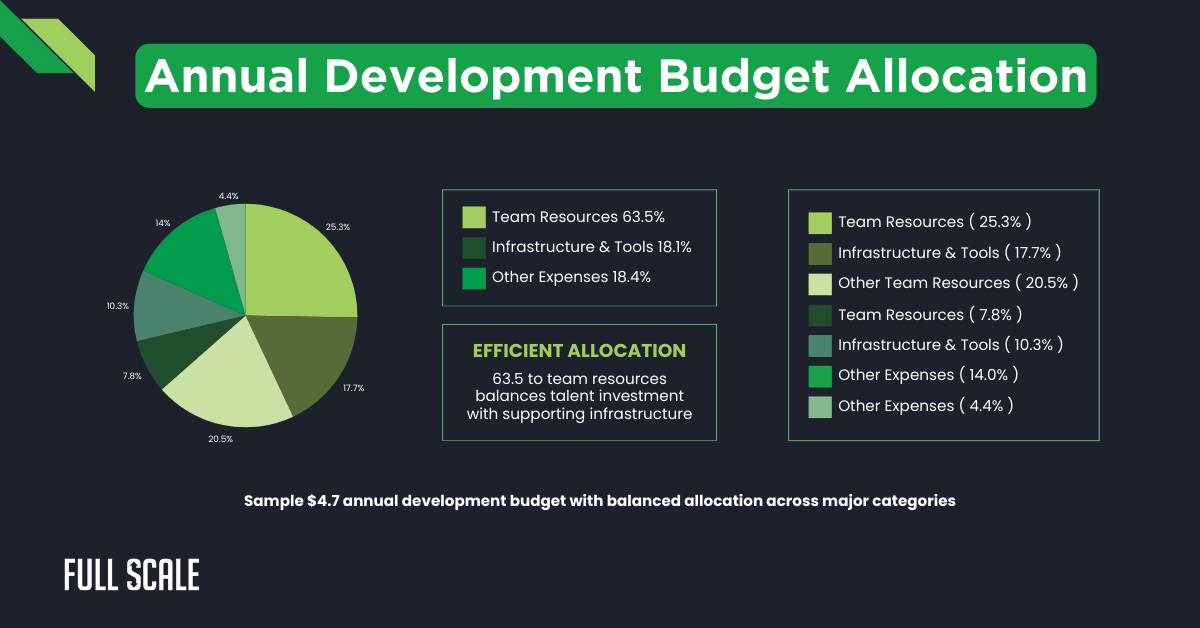
This visualization shows the distribution of development spending across major categories. The allocation reflects industry benchmarks while providing flexibility for specific organizational priorities.
The table below presents a detailed 12-month development budget with quarterly allocation. This structured template creates transparency and alignment for all stakeholders.
| Budget Category | Q1 | Q2 | Q3 | Q4 | Annual Total |
| Team Resources | |||||
| Core Development (In-house) | $300,000 | $300,000 | $300,000 | $300,000 | $1,200,000 |
| Distributed Team (Full Scale) | $180,000 | $210,000 | $240,000 | $210,000 | $840,000 |
| Specialized Skills | $75,000 | $100,000 | $125,000 | $75,000 | $375,000 |
| QA & Testing | $60,000 | $75,000 | $90,000 | $75,000 | $300,000 |
| DevOps & Infrastructure | $90,000 | $90,000 | $105,000 | $90,000 | $375,000 |
| Project Management | $75,000 | $75,000 | $75,000 | $75,000 | $300,000 |
| Infrastructure & Tools | |||||
| Cloud Infrastructure | $85,000 | $90,000 | $100,000 | $95,000 | $370,000 |
| Development Tools | $60,000 | $45,000 | $45,000 | $45,000 | $195,000 |
| Monitoring & Management | $30,000 | $30,000 | $35,000 | $35,000 | $130,000 |
| Security Tools | $45,000 | $40,000 | $40,000 | $40,000 | $165,000 |
| Other Expenses | |||||
| Training & Development | $30,000 | $30,000 | $30,000 | $30,000 | $120,000 |
| Third-Party Services | $40,000 | $40,000 | $45,000 | $45,000 | $170,000 |
| Contingency | $50,000 | $50,000 | $60,000 | $50,000 | $210,000 |
| Quarterly Total | $1,120,000 | $1,175,000 | $1,290,000 | $1,165,000 | $4,750,000 |
This detailed budget template provides a practical implementation framework for predictable development spending. The quarterly distribution reflects typical development cycles and resource needs, with Q3 showing increased allocation for peak development periods.
Effective development budgets incorporate structured variance tracking. These mechanisms identify trends before they create significant impacts and enable proactive financial adjustments. Key tracking elements include:
- Spending variance (monthly review, action trigger >±10%)
- Resource utilization (bi-weekly review, action trigger <85% or >95%)
- Velocity trends (sprint cycle review, action trigger >±15%)
- Quality metrics (monthly review, action trigger for upward trends)
- Capitalization ratio (quarterly review, action below target)
This tracking framework enables proactive financial management through defined triggers that initiate review and adjustment processes.
Measuring Success: Financial KPIs for Development Teams
Measuring financial performance requires connecting technical metrics with business outcomes. These measurements create accountability and support continuous improvement in development spending effectiveness.
Effective measurement connects technical performance with financial outcomes. Key performance indicators for development provide an objective assessment of spending effectiveness.
Development velocity directly impacts financial performance through:
- Accelerated value delivery
- Earlier revenue realization
- Improved market responsiveness
- Enhanced competitive positioning
Quality metrics translate directly into financial terms:
- Defect remediation costs
- Customer impact expenses
- Risk exposure valuation
- Future maintenance obligations
The table below connects technical metrics with their financial implications. This framework helps finance leaders evaluate development investments objectively.
| Technical Metric | Financial Translation | Calculation Method |
| Story Points per Sprint | Value Delivery Rate | Points × Average Feature Value |
| Time to Production | Revenue Acceleration | Earlier Revenue × Time Differential |
| Deployment Frequency | Market Response Agility | Value per Feature × Deployment Increase |
| Feature Completion Rate | Roadmap Value Realization | Completed vs. Planned Feature Value |
| Defect Escape Rate | Rework Cost | Defects × Average Remediation Cost |
This framework connects technical velocity metrics with financial outcomes. The translations create meaningful reporting for executive stakeholders and demonstrate the financial impact of development performance improvements.
Future-Proofing Your Development Budget
Forward-looking financial planning ensures continued effectiveness despite changing market conditions. These approaches create resilient budgets that maintain predictability while adapting to new requirements.
Proactive planning enables organizations to maintain budget effectiveness despite changing conditions. Key future-proofing elements in IT budget forecasting include:
- Technology trend analysis (quarterly review)
- Talent market projections (semi-annual assessment)
- Economic factor evaluation (quarterly adjustment)
- Contingency mechanisms (structured activation triggers)
- Innovation funding (dedicated allocation with specific evaluation criteria)
These elements create resilient budgets that can adapt to changing market conditions while maintaining predictability and alignment with strategic objectives.
The diagram below illustrates an effective contingency framework for development budgets. This structured approach balances preparedness with resource efficiency.
This contingency framework creates a structured response capacity for organizations. The defined triggers and processes ensure appropriate deployment while preventing unnecessary resource allocation to unlikely scenarios.
Optimize Your Development Budget with Full Scale
Managing development spending effectively requires both financial expertise and technical understanding. Achieving predictable spending while maintaining innovation presents significant challenges for finance leaders.
At Full Scale, we specialize in helping organizations implement predictable development budgets through strategic team structures. Our approach combines financial predictability with technical excellence.
Why Full Scale?
- Predictable Spending Models: Our fixed-rate team structures eliminate budget variability with consistent monthly investments.
- Scalable Resources: Rapidly adjust team size to match changing development requirements without recruitment delays.
- Global Talent Economics: Access exceptional technical talent at rates 40-60% below U.S. market rates.
- Financial Transparency: Comprehensive reporting provides complete visibility into resource utilization and delivery metrics.
Don’t let unpredictable development spending disrupt your financial planning. Schedule a free consultation today to learn how Full Scale can transform your development budget into a strategic advantage.
Request a Consultation Today
FAQs: Development Spending
How can I calculate our technical debt’s impact on development spending?
Technical debt affects development spending through maintenance costs, productivity reduction, and increased defects. To calculate its impact:
- Measure maintenance time spent on existing code vs. new features (aim for <20%)
- Track defect rates by system component to identify debt-heavy areas
- Calculate productivity loss by comparing velocity in clean vs. debt-heavy areas
- Multiply engineering hours spent addressing debt by fully-loaded developer costs
What percentage of development spending should be allocated to innovation?
Most organizations allocate 5-10% of development spending to innovation initiatives. This balanced approach enables future growth while maintaining operational excellence. Technology-driven companies may increase this to 15-20% when innovation directly drives competitive advantage. Implement quarterly reviews to assess ROI on innovation investments.
How can distributed teams improve our development spending predictability?
Distributed teams enhance development spending predictability through:
- Elimination of local talent market fluctuations
- Standardized, predictable rate structures
- Rapid scaling capability without recruitment delays
- Reduced fixed cost commitments
- Access to specialized skills without premium costs
Full Scale’s distributed team model provides fixed monthly costs that eliminate budget variability while maintaining quality and productivity.
What are the most effective metrics for measuring development spending efficiency?
Key metrics to evaluate development spending efficiency include:
- Cost per story point (target: $800-1,200)
- Revenue generated per development dollar (target: 3-5x return)
- Defect remediation cost percentage (target: <10% of development)
- Time-to-market improvement (target: 20-30% reduction year-over-year)
- Resource utilization rate (target: 85-95%)
These metrics create direct connections between financial investments and business outcomes for effective software development budget planning.
How should CFOs approach build vs. buy decisions to optimize development spending?
Build vs. buy decisions significantly impact long-term development cost optimization. Evaluate using:
- Initial development cost vs. lifetime licensing expenses
- Implementation timeline comparison (build typically 3-5x longer)
- Maintenance burden (typically 15-20% annually for custom solutions)
- Strategic differentiation value (higher for custom solutions)
- Integration complexity with existing systems
Create a standardized decision framework that balances short-term costs against long-term total cost of ownership.
How frequently should we review and adjust our development budget?
Effective IT budget forecasting requires regular review cycles. Most organizations implement:
- Monthly variance analysis to identify trends early
- Quarterly allocation adjustments to reflect changing priorities
- Semi-annual benchmark reviews against industry standards
- Annual comprehensive budget restructuring
More dynamic market conditions may require more frequent reviews. Implement trigger-based reviews when variance exceeds 10% in any major category.