What is User Experience (UX)? The Complete Guide for Tech Business Owners and Leaders
User experience permeates every aspect of how people interact with your product. Let’s establish a clear understanding of this critical concept before exploring its business impact.
User experience (UX) is the sum of all interactions a person has with a product or service, encompassing their perceptions, emotions, and responses throughout the entire journey.
It includes aspects like usability, accessibility, performance, design aesthetics, utility, and the overall feeling left with the user. Effective user experience design creates meaningful connections between people and products, driving satisfaction, loyalty, and business results.
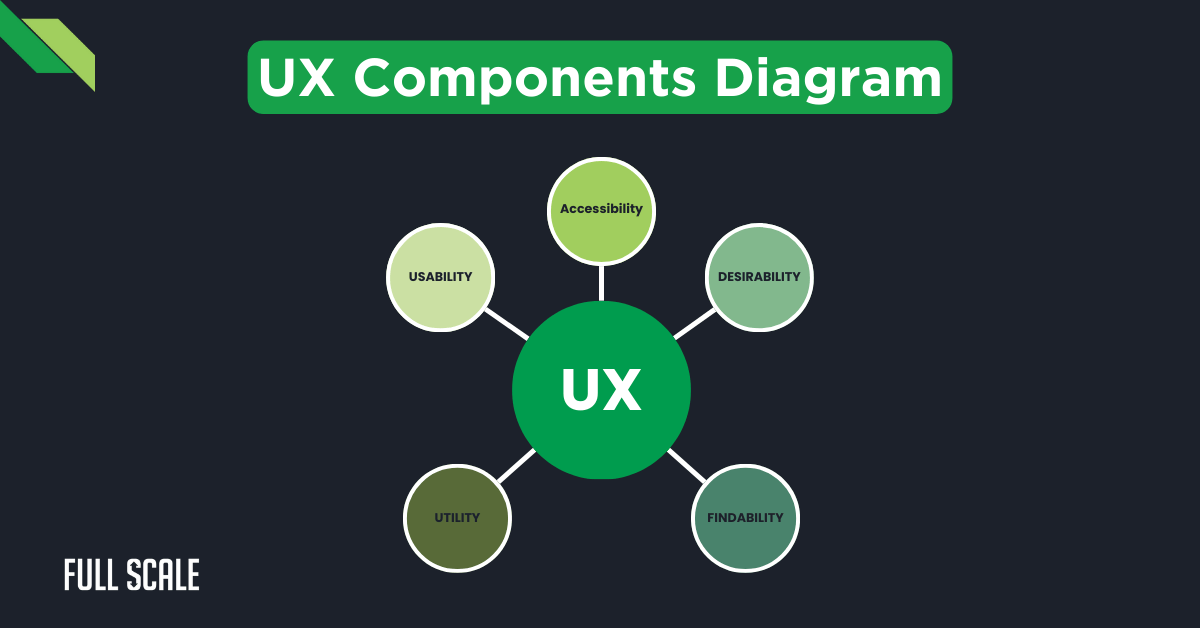
The above diagram illustrates how the core elements of user experience interconnect to create a comprehensive framework. Each component contributes to the overall quality of interaction between users and products.
Business Impact of User Experience
The business value of UX investment is supported by compelling research and measurable outcomes. These key statistics demonstrate why business leaders should prioritize user experience:
- Companies focusing on UX see a 400% return on their UX investment (Forrester Research)
- 88% of online consumers are less likely to return after a poor user experience (Amazon Web Services)
- UX improvements can boost conversion rates by up to 200% (Forrester)
- Effective UX reduces development costs by up to 50% through early issue detection (IBM)
- 70% of customers abandon purchases due to poor user experience (Baymard Institute)
UX vs. UI vs. Interaction Design: Key Differences Explained
Understanding the distinctions between UX, UI, and interaction design helps clarify roles and responsibilities. These interconnected disciplines each contribute uniquely to product success.
Comparative Analysis of Design Disciplines
The following table compares these three essential disciplines across several key dimensions. Understanding these differences helps technical leaders allocate resources appropriately and establish clear roles within product teams.
| Aspect | User Experience (UX) | User Interface (UI) | Interaction Design |
| Focus | Entire user journey and feelings | Visual elements and layout | How users interact with the product |
| Scope | All touchpoints with product/company | Screen-based visual elements | Specific interactive behaviors |
| Goal | Create meaningful, valuable experiences | Create attractive, consistent visuals | Create intuitive, efficient interactions |
| Metrics | Satisfaction, task completion, loyalty | Visual consistency, brand alignment | Efficiency, learnability, error rates |
Relationship Between Design Disciplines
These three disciplines overlap significantly but maintain distinct focuses. UX encompasses the entire user journey, while UI addresses visual implementation. Interaction design bridges both by defining specific behaviors.
Think of UX as the foundation, UI as the aesthetic layer, and interaction design as the behavioral framework. Together, they create cohesive digital experiences that satisfy users and drive business results.
Strategic Value for Technical Leaders
Understanding all three disciplines provides significant advantages for technical decision-makers. These insights help balance resources, streamline development, and maximize return on investment.
- Comprehensive knowledge allows better resource allocation and team structuring
- Understanding distinctions prevents scope confusion and project delays
- Appreciation of all three leads to more cohesive product development
- Technical implementation becomes more efficient with clear discipline boundaries
- ROI improves when these disciplines work in harmony rather than isolation
The 5 Core Elements of User Experience
Five key elements form the foundation of effective UX. Each contributes uniquely to the overall quality of user interactions with your product.

These five elements form the building blocks of successful user experiences. They represent the different facets that designers and developers must address to create effective digital products.
- Usability: How easy and intuitive the product is to use
- Utility: How functional and valuable the product is in meeting user needs
- Accessibility: How usable the product is for people of all abilities
- Desirability: How enjoyable and engaging the product is to use
- Findability: How easily users can locate content and features
Element Definitions and Examples
- Usability: The measure of how efficiently users can accomplish tasks. Good usability minimizes friction through intuitive navigation, clear instructions, and logical workflows. For example, a one-click checkout process demonstrates excellent usability by reducing steps.
- Utility: The functionality that solves real user problems. A product with high utility delivers features that directly address user needs. Consider how Google Maps provides directions, traffic updates, and business information—all utilities that solve real problems.
- Accessibility: Making products usable by people of diverse abilities. This includes considerations for visual, auditory, motor, and cognitive impairments. Examples include screen reader compatibility, keyboard navigation, and color contrast standards.
- Desirability: The emotional appeal that makes users want to engage. This encompasses aesthetics, brand identity, and emotional response. Apple products exemplify desirability through premium design that creates positive emotional connections.
- Findability: How easily users can locate what they need. This includes search functionality, information architecture, and navigation design. Amazon’s powerful search and filtering capabilities demonstrate strong findability.
UX Measurement Framework
This table presents key metrics for evaluating each core element of user experience. These measurements help teams objectively assess UX quality and track improvements over time.
| Element | Key Metrics | Measurement Methods | Target Benchmarks |
| Usability | • Task success rate (%) • Time on task (seconds) • Error rate (%) • SUS score | • Usability testing • Analytics tracking • Error logging • SUS questionnaire | • >85% success rate • <1 min for key tasks • <5% error rate • >68 SUS score |
| Utility | • Feature adoption rate (%) • Feature retention (%) • Problem resolution rate (%) • Value scores | • Feature analytics • Retention tracking • User surveys • Feedback ratings | • >30% adoption • >60% retention • >80% resolution • >4/5 value rating |
| Accessibility | • WCAG compliance level • AT compatibility (%) • Accessibility audit score • Disabled user success | • WCAG evaluations • AT testing • Automated audits • Inclusive testing | • AA compliance • >90% compatibility • >85% audit score • Equal success rates |
| Desirability | • Emotional response ratings • Brand perception • Preference test results • Visual appeal scores | • Emotion surveys • Brand tracking • A/B testing • Design ratings | • >4/5 emotion score • Positive trend • >60% preference • >80% appeal rating |
| Findability | • Search success rate (%) • Navigation success (%) • Time to locate (seconds) • First-click test results | • Search analytics • Task completion • Timing studies • Click testing | • >80% search success • >85% nav success • <20 sec to locate • >70% first-click accuracy |
Business Impact by Element
Each core element of user experience delivers distinct business benefits. Understanding these impacts helps leaders prioritize investments and measure returns effectively.
Usability Impact:
- 25% increase in conversion rates through improved checkout usability
- 35% reduction in support calls after simplifying complex processes
- 40% faster user onboarding, leading to earlier value realization
- 60% reduction in training costs for enterprise software
Utility Impact:
- 30% higher customer retention when core needs are effectively addressed
- 45% increase in feature adoption through needs-based development
- 20% premium price potential for highly functional products
- 50% reduction in development waste by focusing on valuable features
Accessibility Impact:
- Access to a 15% larger market by accommodating diverse users
- 25% reduction in legal risk through compliance
- 10% increase in SEO performance through accessibility improvements
- Enhanced brand reputation as an inclusive company
Desirability Impact:
- 40% higher social sharing of aesthetically pleasing products
- 30% increase in repeat visits for engaging experiences
- 20% longer user session times for desirable interfaces
- 15% higher willingness to pay for premium experiences
Findability Impact:
- 50% reduction in abandoned searches
- 30% increase in cross-sell/upsell through better content discovery
- 25% increase in self-service success rates
- 40% reduction in support requests for finding information
The ROI of User Experience: By the Numbers
Investing in user experience design delivers measurable financial returns. The data shows clear correlations between UX investment and business performance across multiple metrics.
Financial Impact Statistics
These compelling statistics demonstrate the business value of user experience design. They provide strong evidence for justifying UX investments and setting realistic expectations for returns.
- Every $1 invested in UX returns $100 (ROI of 9,900%) – Forbes
- Improving customer experience increases revenue by 83% – ClooTrack
- UX optimization reduces development costs by 50% – IBM Design
Cost of Poor UX
Inadequate user experience creates significant business costs beyond lost revenue. These figures illustrate the hidden expenses that accumulate when UX is neglected.
- Support costs increase by 33% with difficult-to-use interfaces
- Customer acquisition costs rise by 50% when overcoming negative reviews
- Development rework increases by 40-100% without early UX testing
Before/After UX Improvement Case Studies
These real-world examples demonstrate the tangible business impact of UX improvements. Each case illustrates how specific UX changes led to measurable business outcomes across different industries.
E-commerce Platform Redesign
- Before: 3.2% conversion rate, $46 average order value
- After: 6.4% conversion rate, $65 average order value
- Result: $2.3M additional annual revenue
Enterprise Software Dashboard
- Before: 23 minutes average task completion time, 87% error rate
- After: 7 minutes average task completion time, 12% error rate
- Result: $1.5M annual productivity savings
Mobile Banking App
- Before: 2.7 star app rating, 62% abandonment rate
- After: 4.6 star app rating, 18% abandonment rate
- Result: 41% increase in mobile transaction volume
Use our UX ROI Calculator to estimate your potential returns from investing in user experience improvements. This tool helps quantify the business impact across key metrics specific to your industry.
How to Integrate UX into Your Product Development Process
Embedding user experience activities throughout development ensures user needs remain central. This systematic approach prevents costly rework and improves outcomes for both users and businesses.
UX Integration Process Framework
This step-by-step guide outlines how to incorporate user experience activities into traditional product development workflows. Each phase includes key activities that ensure user-centered design principles are applied consistently.
1. Research Phase: Gather user insights before technical planning
- Conduct user interviews and surveys
- Analyze existing user data and feedback
- Create user personas and journey maps
- Identify pain points and opportunities
2. Strategy Phase: Align UX goals with business objectives
- Define success metrics and KPIs
- Establish UX principles and guidelines
- Prioritize user needs against business requirements
- Create experience, vision, and roadmap
3. Design Phase: Create wireframes, prototypes, and user flows
- Develop information architecture
- Design interface wireframes and mockups
- Create interactive prototypes
- Establish design patterns and components
4. Development Phase: Implement designs with technical excellence
- Collaborate with developers on implementation details
- Conduct regular design reviews
- Address technical constraints while preserving UX integrity
- Develop modular, reusable components
5. Testing Phase: Validate solutions with real users
- Conduct usability testing sessions
- Analyze user behavior data
- Identify usability issues and opportunities
- Iterate on designs based on feedback
6. Launch Phase: Monitor initial user feedback
- Collect analytics data
- Conduct post-launch user interviews
- Monitor support requests and issues
- Prepare for rapid iterations
7. Iteration Phase: Continuously improve based on data
- Analyze performance against KPIs
- Identify optimization opportunities
- Plan and prioritize improvements
- Implement regular enhancement cycles
Integration Workflow Visualization
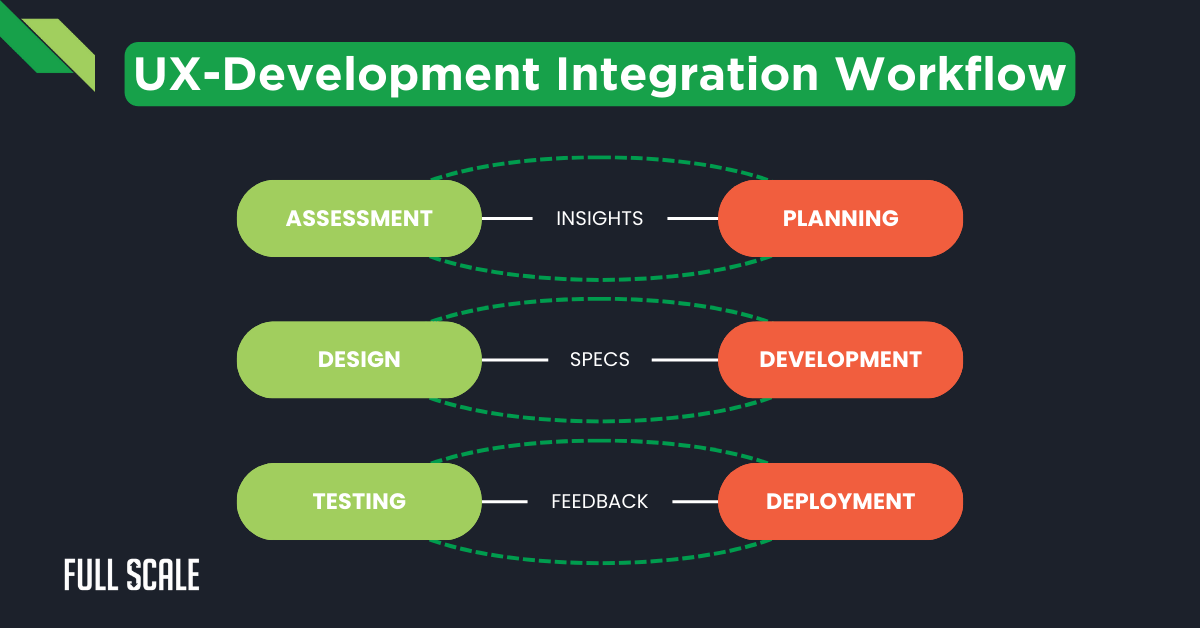
The diagram above illustrates how UX activities integrate with traditional development processes. This visual representation helps teams understand the parallel tracks and intersection points between UX and development work.
Common Integration Questions
These frequently asked questions address the most common concerns about implementing UX processes within existing development workflows. They provide practical guidance for organizations transitioning to more user-centered approaches.
Q: When should UX designers join the development process?
A: UX designers should join at the very beginning, ideally before requirements are finalized. Early involvement prevents costly rework and ensures user needs drive development decisions from the start.
Q: How do agile methodologies accommodate UX work?
A: Agile teams integrate UX by conducting research and design activities 1-2 sprints ahead of development. Design sprints, parallel tracks, and continuous user testing allow UX to maintain pace with development cycles.
Q: What UX deliverables are essential for technical teams?
A: Technical teams need annotated wireframes, interaction specifications, user flows, design systems, and component documentation. These deliverables provide clear implementation guidance while maintaining design intent.
Q: How much overlap should exist between UX and development teams?
A: Significant overlap is ideal. UX designers should attend development standups, while developers should participate in design reviews and usability testing. This cross-functional collaboration ensures shared understanding.
Key UX Methodologies Every Business Leader Should Know
Understanding established user experience methodologies helps leaders implement effective processes. These approaches provide frameworks for systematic user-centered product development.
Core UX Methodologies Defined
These methodologies represent the most widely adopted approaches to user experience design. Each framework offers distinct advantages for specific business contexts and development environments.
User-Centered Design (UCD): A design approach that places users and their needs at the center of every design decision. UCD involves users throughout the development process to ensure products truly solve their problems.
Design Thinking: A non-linear, iterative process that teams use to understand users, challenge assumptions, redefine problems, and create innovative solutions through five phases: Empathize, Define, Ideate, Prototype, and Test.
Jobs-to-be-Done (JTBD): A framework focusing on the ‘job’ customers are trying to accomplish rather than customer attributes or product features. It helps teams understand the true motivations behind product usage.
Lean UX: An approach that applies lean principles to UX design, focusing on reducing waste and delivering value quickly through smaller, iterative releases based on validated learning.
Methodology Selection Guide
This comparative table helps organizations select the most appropriate UX methodology based on their specific project needs, team structure, and timeline constraints. Each approach offers distinct advantages for different contexts.
| Methodology | Best For | Project Types | Team Structure | Time Frame |
| User-Centered Design | Established products with a clear user base | Complex systems, Enterprise software | Dedicated UX team | Medium to long-term |
| Design Thinking | Novel problems, Innovation challenges | New products, Major redesigns | Cross-functional teams | Short discovery sprints |
| Jobs-to-be-Done | Market repositioning, Feature prioritization | Product strategy, Value proposition design | Product teams | Strategic planning cycles |
| Lean UX | Fast-moving environments, Startups | MVPs, Feature experiments | Embedded designers in dev teams | Rapid iterations |
Real-World Implementation Examples
These case studies demonstrate how different UX methodologies have been successfully applied across various industries. They provide concrete examples of implementation approaches and measurable outcomes.
User-Centered Design in Healthcare: A medical records system implemented UCD by shadowing doctors and nurses, creating detailed task analyses, and conducting multiple rounds of usability testing. This resulted in 43% faster information retrieval and 28% fewer medical errors.
Design Thinking in Financial Services: A banking app used design thinking to completely reimagine the mortgage application process. By deeply empathizing with home buyers’ anxieties, they created a solution that reduced application abandonment by 58% and increased approval rates by 22%.
Jobs-to-be-Done in Transportation: A rideshare company applied JTBD to discover that customers weren’t just “hiring” their service for transportation but for “avoiding parking hassles” and “using commute time productively.” This insight led to premium work-friendly vehicles that commanded 35% higher fares.
Lean UX in E-commerce: An online retailer used Lean UX to test checkout improvements. Instead of a complete redesign, they ran weekly experiments on specific elements, measuring impact. This approach increased conversions by 23% over three months without disrupting the entire user experience.
How to Measure UX Success: Essential Metrics
Effective measurement transforms user experience from subjective opinion to objective impact. These metrics provide concrete evidence of UX improvements and business value.
Key UX Metrics Guide
Understanding what metrics to track and how to interpret them is essential for demonstrating UX value. This Q&A section addresses common questions about UX measurement approaches.
Q: What are the most important UX metrics to track?
A: The essential UX metrics include: Task Success Rate, Time on Task, Error Rate, System Usability Scale (SUS), Customer Satisfaction (CSAT), Net Promoter Score (NPS), Conversion Rate, and User Retention.
Q: How do you calculate a System Usability Scale score?
A: Collect responses to 10 standard questions on a 5-point scale. For odd-numbered questions (1,3,5,7,9), subtract 1 from the score. For even-numbered questions (2,4,6,8,10), subtract the score from 5. Add all values and multiply by 2.5 for a final score out of 100.
Q: What is a good benchmark for task success rate?
A: Industry standards suggest that a task success rate above 85% indicates good usability. E-commerce typically targets 90%+, while complex enterprise systems may accept 80%+ as successful, according to Nielsen Norman Group research.
Comprehensive UX Metrics Dashboard
This comprehensive table provides a framework for measuring user experience across different dimensions. Use it to establish baselines, set improvement targets, and demonstrate business impact for UX initiatives.
| Metric | What it Measures | How to Measure | Industry Benchmarks | Business Impact |
| Task Success Rate | Effectiveness of design for specific tasks | % of users who complete a task successfully | >85% is good, >95% is excellent | 10% improvement can increase conversions by 21% |
| Time on Task | Efficiency of interactions | Average time to complete specific tasks | Varies by task complexity | 20% reduction can improve satisfaction by 32% |
| Error Rate | Usability issues in design | % of users making errors during tasks | <5% for critical tasks | 50% reduction can decrease support costs by 26% |
| System Usability Scale | Overall usability perception | 10-question standardized survey (0-100) | >68 is above average, >80 is excellent | 10 point increase correlates with 24% higher NPS |
| Customer Satisfaction | User happiness with experience | Post-interaction survey (CSAT) | >80% is good, >90% is excellent | 5% improvement can increase retention by 14% |
| Net Promoter Score | Likelihood to recommend | 0-10 scale, % promoters minus % detractors | >30 is good, >50 is excellent | 10 point increase typically raises revenue by 9% |
| Conversion Rate | Effectiveness at driving desired actions | % of users who complete target action | Varies by industry and action type | 1% increase often translates to 7-12% revenue growth |
| User Retention | Long-term value of experience | % of users who return within specific period | Varies by product type | 5% increase typically raises customer lifetime value by 25-95% |
How Does UX Reduce Technical Debt and Development Costs?
Smart user experience investment prevents expensive technical problems before they occur. This preventative approach yields substantial savings throughout the product lifecycle.
Technical Debt Reduction Mechanisms
These five key mechanisms explain how UX practices directly impact technical debt and development efficiency. Understanding these connections helps leaders recognize the technical value of user experience investment.
1. Prevents rework through early validation
- Identifying usability issues before coding saves 4-5x the cost
- Early prototyping exposes flaws in requirements and assumptions
- User testing validates solutions before significant development investment
- Clear design documentation reduces implementation misinterpretations
2. Creates consistent implementation patterns
- Component libraries standardize interface elements
- Design systems reduce redundant code and inconsistencies
- Documented patterns speed the development of new features
- Unified experiences require less custom code
3. Reduces feature bloat through user prioritization
- User research identifies truly valuable features
- Evidence-based prioritization prevents unnecessary development
- Focus on core user needs eliminates superfluous functionality
- Simplified codebase improves maintenance efficiency
4. Streamlines technical requirements
- User-centered specifications reduce ambiguity
- Clear acceptance criteria prevent scope creep
- Defined user flows create architectural clarity
- Performance expectations set appropriate technical boundaries
5. Improves documentation and knowledge transfer
- Centralized design systems preserve institutional knowledge
- Clear interaction specifications reduce questions during implementation
- Visual documentation complements technical specifications
- Shared understanding between design and development teams
UX ROI Calculator
This calculator helps quantify the potential savings from UX investments by comparing development costs with and without proper user experience practices. The examples below illustrate typical scenarios for different project types.
UX ROI Calculator
Calculate your potential savings from UX investments by comparing development costs with and without proper user experience practices.
| WITHOUT UX | WITH UX | SAVINGS | |
|---|---|---|---|
| Initial Development Cost | $190,000 | $190,000 | $0 |
| Rework Cost | $190,000 | $9,500 | $180,500 |
| UX Investment | $0 | $15,000 | -$15,000 |
| TOTAL COST | $380,000 | $214,500 | |
| NET SAVINGS | $165,500 | ||
| ROI PERCENTAGE | 1103% |
How This Calculator Works:
This calculator shows how UX investment reduces development costs by preventing rework. Studies show that fixing issues after development can cost 4-5x more than addressing them during the design phase.
Real-world example: A financial services company saved $165,500 through early UX testing by reducing post-development rework from 100% to just 5%.
Real-world examples:
Early UX testing reduced development rework by 50%, saving $380,000 at FinTech Corp
- Initial estimate: 2,000 development hours at $95/hour = $190,000
- Without UX testing: 4,000 actual hours (100% increase) = $380,000
- With UX testing: 2,100 actual hours (5% increase) = $199,500
- Total savings: $180,500 minus $15,000 UX testing cost = $165,500 net savings
Consistent UX patterns reduced implementation time by 35%, saving $245,000 at TechSolutions Inc
- Before: 12 developers spending 40% of time on UI inconsistencies = $576,000 annually
- After: Design system implementation reduced this to 5% = $72,000 annually
- Annual savings: $504,000 minus $259,000 design system investment = $245,000 net first-year savings
UX-Related Technical Debt Checklist
Use this diagnostic table to identify UX-related technical debt in your products. If multiple indicators apply to your situation, consider addressing these issues as part of your technical debt reduction strategy.
| Warning Sign | What to Look For | Potential UX Solution |
| Design-related change requests | Frequent post-development UI/UX changes | Implement earlier design reviews and approvals |
| Inconsistent interface patterns | Different styles/interactions for similar features | Develop a consistent design system |
| High support volume | Many questions about how to use features | Improve in-app guidance and usability |
| Duplicate functionality | Multiple features solving the same problem | Conduct user research to consolidate features |
| Low feature usage | Features with <5% adoption rates | Implement usage analytics and feature rationalization |
| Custom UI code duplication | Similar UI elements with different code | Create a reusable component library |
| Technical stability but poor satisfaction | System works but users complain | Focus on usability testing and improvements |
| Developer confusion | Uncertainty about how to implement designs | Improve design documentation and specifications |
| Extended QA cycles | Many usability-related defects | Implement earlier UX testing and validation |
| Requirement interpretation issues | Multiple readings of the same requirements | Create clearer user stories with acceptance criteria |
UX Implementation Roadmap
This phased approach helps organizations systematically address UX-related technical debt. The roadmap provides realistic timeframes and key activities for each implementation stage.
What Makes a Good User Experience? The 7 Factors
Seven universal factors determine UX quality across all products and services. Understanding these helps teams create experiences that truly resonate with users.
- Useful: The product solves real user problems
- Usable: The product is easy to use and navigate
- Findable: Users can quickly locate what they need
- Credible: The product instills trust and confidence
- Desirable: The product creates positive emotions
- Accessible: The product works for users of all abilities
- Valuable: The product delivers clear benefits to users and businesses
UX Factor Assessment Questions
These questions help teams evaluate their products against each UX factor. Use them during product reviews and planning sessions to identify improvement opportunities.
Useful Assessment:
- Does our product address genuine user needs and problems?
- Are we solving the right problems for our target audience?
- Do users achieve their goals when using our product?
- What percentage of features are regularly used?
Usable Assessment:
- Can users complete common tasks without assistance?
- What is our task success rate for key workflows?
- How does our error rate compare to industry standards?
- Do users need extensive training to use our product?
Findable Assessment:
- How quickly can users locate specific information or features?
- What percentage of users rely on search vs. navigation?
- Do users abandon tasks due to difficulty finding things?
- Are important features and content prominently displayed?
Credible Assessment:
- Do users trust the information and functionality we provide?
- Is our security and privacy approach transparent and reassuring?
- Does our design communicate professionalism and reliability?
- Do we clearly explain how user data is used and protected?
Desirable Assessment:
- Do users enjoy interacting with our product?
- Does our design evoke positive emotional responses?
- How does our aesthetic compare to competitors?
- Would users choose our product based on experience alone?
Accessible Assessment:
- Does our product work for people with disabilities?
- What WCAG compliance level have we achieved?
- Have we tested with assistive technologies?
- Are we excluding potential users with our current design?
Valuable Assessment:
- Does our product provide a clear return on investment?
- How does the value delivered compare to the cost?
- Are users achieving meaningful outcomes?
- Do users and stakeholders perceive adequate value?
UX Improvement Techniques by Factor
These practical techniques help teams improve specific aspects of user experience. Each approach addresses one of the seven UX factors with proven methods for enhancement.
Useful Improvement Techniques:
- Conduct jobs-to-be-done research to identify core user needs
- Implement usage analytics to identify underused features
- Create user journey maps to identify gaps in functionality
- Use feature prioritization frameworks (RICE, MoSCoW)
Usable Improvement Techniques:
- Conduct regular usability testing with representative users
- Implement task analysis for key workflows
- Apply heuristic evaluation using established principles
- Create and test simplified user flows for common tasks
Findable Improvement Techniques:
- Conduct card sorting exercises to improve information architecture
- Implement search analytics to identify content gaps
- Use tree testing to validate navigation structures
- Apply progressive disclosure for complex information
Credible Improvement Techniques:
- Prominently display security certifications and policies
- Implement social proof through testimonials and reviews
- Ensure design consistency across all touchpoints
- Provide transparency about business practices
Desirable Improvement Techniques:
- Conduct aesthetic preference testing
- Implement mood boards and style guides
- Use microinteractions to create moments of delight
- Apply emotional design principles
Accessible Improvement Techniques:
- Implement automated accessibility testing
- Conduct usability testing with disabled users
- Create accessibility guidelines and checklists
- Train teams on inclusive design practices
Valuable Improvement Techniques:
- Calculate and communicate ROI for key features
- Implement value-based pricing models
- Collect and showcase customer success stories
- Align features with measurable business outcomes
UX Best Practices for Different Digital Products
Different product types require specialized UX approaches. These tailored best practices address the unique contexts and constraints of various digital products.
Website UX Best Practices
The foundation of effective website UX starts with performance. Research shows that 53% of mobile users abandon sites that take longer than 3 seconds to load. Beyond speed, responsive design ensures accessibility across devices, while clear navigation prevents the 38% of users who leave due to poor navigation.
To enhance these efforts further, digital marketing experts can also help by improving your site’s SEO, which in turn improves site structure and content relevance—positively impacting the overall user experience.
- Optimize page load speed (under 3 seconds)
- Ensure mobile responsiveness
- Create clear navigation hierarchies
- Implement consistent interaction patterns
- Prioritize content readability
Mobile App UX Best Practices
Mobile experiences must accommodate on-the-go contexts. With 49% of users operating phones one-handed, a thumb-friendly design is essential. Reducing input decreases the 27% error rate typical of mobile keyboards, while offline functionality addresses inconsistent connectivity.
- Design for one-handed usage
- Minimize user input requirements
- Optimize for offline capabilities
- Use platform-specific design patterns
- Ensure smooth transitions and animations
Enterprise Software UX Best Practices
Enterprise users need efficiency above all. Research shows knowledge workers spend 36% of their time searching for information. Consistent terminology reduces the 20% error rate caused by confusing labels, while customization accommodates diverse workflows within organizations.
- Prioritize efficiency for frequent tasks
- Create comprehensive search capabilities
- Develop consistent terminology
- Build flexible customization options
- Design clear data visualization patterns
E-commerce Platform UX Best Practices
E-commerce success hinges on removing purchase barriers. With 69% of carts abandoned, streamlined checkout is critical. Detailed product information addresses the 53% of shoppers who need complete specifications before purchasing, while robust filtering helps the 76% who prefer browsing over searching.
- Simplify the checkout process
- Provide detailed product information
- Implement intuitive filtering and sorting
- Design for product comparison
- Create seamless cross-device shopping experiences
SaaS Application UX Best Practices
SaaS applications must balance power with simplicity. Effective onboarding reduces the 55% of users who abandon complex software. Progressive disclosure prevents 43% of users from being overwhelmed by feature-rich interfaces, while contextual guidance reduces the support burden by up to 30%.
- Create intuitive onboarding flows
- Design for customization without complexity
- Implement progressive disclosure of features
- Provide contextual help and guidance
- Design for collaboration and sharing
Healthcare Application UX Best Practices
Healthcare applications operate in unique contexts. Privacy-focused design addresses the 72% of patients concerned about health data security. Designing for stress acknowledges that 63% of users access health information during difficult situations, while accessibility accommodates the diverse physical capabilities of users.
- Prioritize privacy and security in the interface
- Design for high-stress, low-attention contexts
- Implement accessible interfaces for diverse users
- Create clear information hierarchies for critical data
- Design for interoperability with existing systems
Common UX Mistakes and How to Avoid Them
Even experienced teams make predictable UX mistakes. Recognizing and preventing these issues saves substantial time, money, and customer goodwill.
Common UX Pitfalls and Solutions
These problem-solution pairs address the most frequent UX mistakes organizations make. Each solution includes specific, actionable approaches backed by research and industry best practices.
Problem: Starting development without user research
Solution: Conduct at least 5 user interviews before finalizing requirements to reduce development rework by up to 50%.
Without user research, teams build based on assumptions rather than evidence. Nielsen Norman Group research shows that just 5 user interviews identify approximately 85% of major usability issues. Starting development after this minimal research prevents the 50-200% cost increase associated with fixing problems after coding.
Problem: Confusing navigation structures
Solution: Implement card sorting exercises with 8-12 users to create an intuitive information architecture.
Navigation confusion causes 38% of website abandonment. Card sorting with 8-12 participants reveals how users naturally categorize information. This sample size identifies about 90% of organizational patterns, according to Information Architecture Institute studies. Implementing these insights reduces failed searches by approximately 28%.
Problem: Inconsistent design patterns
Solution: Develop a component library and design system to ensure consistency and reduce development time by 40%.
Interface inconsistency increases cognitive load and error rates. Component libraries create unified experiences while reducing development time by 40-60%, according to industry case studies. Design systems also decrease defects by 25-35% by eliminating conflicting patterns and establishing clear standards.
Problem: Prioritizing features over user needs
Solution: Use the Kano model to classify features by user satisfaction impact before finalizing roadmaps.
Feature-driven development often creates bloated products with low adoption rates. The Kano model categorizes features as basic, performance, or delight factors based on user satisfaction impact. Teams using this model report 32% higher feature adoption and 24% less development waste through better prioritization.
Problem: Neglecting performance optimization
Solution: Set performance budgets early in development; each 100ms delay in load time can reduce conversions by 7%.
Performance directly impacts business metrics. Amazon found that each 100ms of latency cost them 1% in sales, while Google observed that 400ms delays reduced search volume by 0.6%. Setting performance budgets establishes clear expectations and prevents 70% of users from abandoning slow experiences.
UX Issues Diagnostic Table
This checklist helps teams identify potential user experience issues in their products. Use it as part of regular UX audits to detect problems before they impact users and business metrics.
| Issue Area | Warning Signs | Detection Methods | Severity Indicators |
| Navigation | • Users rely heavily on search • High bounce rates • Circuitous user paths • “Where do I find” support questions • Hesitation at decision points | • Analytics review • Heatmap analysis • Support ticket analysis • User interviews • Usability testing | • >30% search dependence • >60% bounce rate • >5 clicks to key content • >20% navigation questions • >3 sec decision hesitation |
| Consistency | • Multiple similar components • Inconsistent terminology • Variable interaction patterns • Design variations across product • Duplicate implementations | • Visual audit • Content inventory • Code review • Design system gap analysis • Development team feedback | • >3 versions of components • >10% terminology conflicts • >5 interaction inconsistencies • Visible style variations • >15% duplicate functionality |
| Feature Bloat | • Low feature adoption • User overwhelm reports • Growing documentation • Declining dev velocity • Rising maintenance costs | • Usage analytics • User feedback review • Documentation audit • Sprint velocity tracking • Maintenance time tracking | • <5% feature adoption • >25% of overwhelm mentions • >20% documentation growth • >15% velocity decrease • >25% maintenance increase |
| Performance | • Slow page loads • Jerky animations • Interaction blocking • Mobile performance gap • Loading abandonment | • Page speed tests • Animation frame rate • Main thread analysis • Mobile/desktop comparison • Funnel analysis | • > 3-second load times • <45 fps animations • >50ms blocking time • >40% mobile performance gap • >25% loading abandonment |
How to Build a UX Strategy: A Step-by-Step Guide
A structured UX strategy connects user experience to business outcomes. This framework provides direction and measurable goals for UX initiatives.
Strategic UX Planning Process
This step-by-step guide outlines how to develop and implement a comprehensive UX strategy. Each phase includes key activities that align user experience initiatives with business objectives.
Assess Current State
- Conduct a UX audit of existing products
- Benchmark against competitors
- Identify key improvement opportunities
Begin by understanding where you stand today. Use quantitative metrics like task success rates and qualitative insights from user sessions. Compare against industry standards to identify gaps and opportunities.
1. Define Vision and Goals
- Align UX objectives with business strategy
- Set measurable UX targets
- Define success metrics
Connect user experience directly to business outcomes. For example, improving checkout UX might target a 15% conversion increase, directly impacting revenue goals. Document specific, measurable targets.
2. Resource Planning
- Determine team structure and skills needed
- Build vs. hire decisions
- Budget allocation framework
Assess your current capabilities against strategy needs. Consider the optimal mix of in-house talent, agency partners, and specialized consultants. Develop a resource allocation model based on project priorities.
3. Implementation Roadmap
- 30-day quick wins
- 90-day structural improvements
- 6-month transformation initiatives
- 12-month excellence program
Balance short-term improvements with foundational changes. Quick wins build momentum and demonstrate value, while longer-term initiatives create sustainable UX maturity. Sequence activities logically with clear dependencies.
4. Governance Framework
- Design system development
- Review and approval processes
- Quality assurance methods
Establish mechanisms to maintain UX quality over time. Define decision-making authorities, review processes, and quality standards. Create guidelines that provide clarity without restricting innovation.
UX Strategy Blueprint Resource
Use our UX Strategy Blueprint to create your plan. This template guides you through each strategy component with examples, worksheets, and validation methods to ensure comprehensive coverage and stakeholder alignment.
UX Strategy Case Studies
These real-world examples demonstrate successful UX strategy implementation across different industries. They provide valuable insights into effective approaches, challenges, and measurable outcomes.
Financial Services Provider
- Before: 2.8% application completion rate, 32-minute process
- Strategy Focus: Simplify complex workflows, reduce form abandonment
- Key Initiatives: Field validation, progress indicators, save-and-resume
- After: 7.3% completion rate, 13-minute process
- Business Impact: $4.2M annual revenue increase
Healthcare Technology Platform
- Before: 68% training completion, high support volume
- Strategy Focus: Intuitive navigation, contextual guidance
- Key Initiatives: Guided workflows, embedded tutorials, terminology review
- After: 94% training completion, 42% lower support costs
- Business Impact: 22% faster deployment for new clients
E-commerce Retailer
- Before: 2.1% conversion rate, 3.2 pages per session
- Strategy Focus: Discovery improvements, mobile optimization
- Key Initiatives: Search enhancements, personalization, checkout redesign
- After: 3.5% conversion rate, 5.7 pages per session
- Business Impact: 38% increase in average order value
UX Glossary: Key Terms Business Leaders Should Know
Understanding UX terminology enables more effective collaboration between business and design teams. This common language helps leaders evaluate recommendations and communicate more effectively.
Essential UX Terminology
These key terms form the foundation of user experience practice. Familiarizing yourself with this vocabulary helps evaluate design recommendations, allocate resources appropriately, and communicate more effectively with UX practitioners.
A/B Testing: A method of comparing two versions of a design to determine which performs better based on user behavior metrics.
Accessibility: The practice of designing products usable by people with the widest range of abilities and disabilities.
Card Sorting: A UX research technique where users organize topics into groups to help create an intuitive information architecture.
Conversion Rate: The percentage of users who take a desired action, such as completing a purchase or signing up for a service.
Design System: A collection of reusable components, guided by clear standards, that can be assembled to build any number of applications.
First-Time User Experience (FTUE): The initial experience a user has when using a product for the first time.
Heatmap: A visual representation of user interaction data showing where users click, tap, or focus attention.
Information Architecture: The structural design of shared information environments that help users find and understand content.
Minimum Viable Experience (MVE): The simplest version of a user experience that meets both user needs and business goals.
Persona: A research-based, fictional representation of your target user or customer.
User Flow: The path taken by a typical user on a website or app to complete a task.
Usability Testing: The practice of testing how easy a design is to use with a group of representative users.
Contextual Usage Guide
These terms form the foundation of UX practice and provide context for UX decisions. Understanding this vocabulary helps business leaders evaluate UX recommendations, allocate resources appropriately, and communicate more effectively with UX practitioners.
Related Concepts Map
These relationships between key UX terms illustrate how different concepts connect and influence each other. This interconnected understanding helps teams develop more cohesive user experience strategies.
- A/B Testing relates to Conversion Rate as a measurement method
- Accessibility connects to Universal Design principles
- Card Sorting informs Information Architecture development
- Design Systems contain standardized User Flows
- Personas drive the development of targeted First-Time User Experiences
- Heatmaps provide data for Usability Testing analysis
UX Case Studies: Measurable Business Impact
Real-world examples demonstrate how UX improvements drive significant business results. These cases provide compelling evidence for justifying user experience investments.
Transformation Success Stories
These case studies showcase significant business impact resulting from user experience improvements. Each example includes the challenge, solution approach, and quantifiable outcomes to demonstrate ROI.
Case Study 1
Financial Services Platform Challenge: Complex user flows leading to a 40% abandonment rate
UX Solution: Streamlined authentication and transaction flows
Results:
- 65% reduction in abandonment rate
- 28% increase in transaction volume
- $4.2M additional annual revenue
- 42% decrease in support tickets
This financial services provider completely redesigned their authentication and transaction processes. The UX team conducted customer journey mapping to identify friction points, then implemented progressive disclosure techniques. They eliminated unnecessary form fields, reduced steps by 40%, and added clear progress indicators.
Case Study 2
B2B SaaS Dashboard Challenge: Low feature adoption and high training costs
UX Solution: User-centered dashboard redesign with progressive disclosure
Results:
- 86% increase in feature adoption
- 40% reduction in onboarding time
- 52% decrease in support tickets
- 23% improvement in customer retention
This B2B software company transformed its complex dashboard using role-based design techniques. The UX team conducted contextual inquiry with users across different roles, then created personalized views that displayed only relevant information. They implemented guided tutorials and contextual help, dramatically reducing the learning curve.
Case Study 3
Internal Enterprise Tool Challenge: Low efficiency and high error rates in critical workflows
UX Solution: Task-centered redesign with streamlined data entry
Results:
- 68% reduction in task completion time
- 91% decrease in data entry errors
- $1.2M annual productivity savings
- 37% improvement in employee satisfaction
A large corporation redesigned its inventory management system using task analysis and workflow optimization. The UX team shadowed employees performing real tasks, identifying unnecessary steps and error-prone processes. They implemented batch operations, keyboard shortcuts, and validation rules that dramatically improved efficiency.
Streamline User Experience with Full Scale
Optimizing user experience requires specialized expertise and dedicated resources. Many organizations struggle to build and maintain in-house UX capabilities for their digital products.
At Full Scale, we specialize in helping businesses like yours build and manage development teams equipped with UX design skills and technical implementation expertise. Our approach ensures your products deliver exceptional user experiences that drive measurable business results.
How Full Scale Enhances Your UX Implementation
Our specialized teams combine technical expertise with user-centered design principles to create seamless digital experiences. We help you balance business goals with user needs through our comprehensive approach.
- Expert UX-Focused Teams: Our developers and designers understand both technical requirements and user-centered design principles
- Seamless Integration: Our teams work within your existing processes while introducing UX best practices
- Balanced Solutions: We help you achieve the right balance between business goals, technical constraints, and user needs
- Measurable Results: We focus on UX improvements that deliver quantifiable business impact
Don’t let poor user experience limit your product’s potential. Schedule a free consultation today to learn how Full Scale can help your team create digital experiences that users love.
Develop A Better UX
FAQs: What is User Experience (UX)
What is user experience design, and why is it important for my business?
User experience design is creating products that provide meaningful, relevant, and enjoyable experiences for users. It encompasses all aspects of user interaction with your company, products, and services.
- Drives customer satisfaction and loyalty
- Increases conversion rates by 200-400%
- Reduces development costs by eliminating rework
- Differentiates your product in competitive markets
- Creates meaningful connections between users and your brand
What are the core elements of a good user experience?
A successful user experience design incorporates five essential elements that work together to create products users love:
- Usability – How easy and intuitive the product is to use
- Utility – How functional the product is in meeting user needs
- Accessibility – How usable the product is for people of all abilities
- Desirability – How enjoyable and engaging the product is to use
- Findability – How easily users can locate content and features
What’s the difference between UX and UI design?
While closely related, user experience and user interface design serve different functions:
- UX Design focuses on the entire user journey and overall experience
- UI Design addresses visual implementation and interface aesthetics
- UX encompasses all touchpoints with a product or company
- UI specifically deals with screen-based visual elements
- UX determines how it works; UI determines how it looks
How do you measure the ROI of user experience investments?
User experience ROI can be measured through several key metrics that directly impact business performance:
- Conversion rate improvements (typically 10-35%)
- Decrease in support costs (25-60% reduction)
- Development savings through reduced rework (50-200% cost prevention)
- Customer retention increases (15-25% improvement)
- Task completion rate increases (75-85% for optimized experiences)
How can Full Scale help improve our product’s user experience?
Full Scale provides expert development teams with strong user experience design capabilities to help transform your digital products:
- UX-focused developers who understand both technical requirements and user needs
- Seamless integration of UX best practices into your existing development process
- Balanced solutions that align business goals with technical constraints
- Measurable improvements to user experience metrics and business outcomes
- Staff augmentation that scales with your specific UX implementation needs
How long does it take to see results from UX improvements?
The timeline for seeing results from user experience investments varies by project type:
- Quick wins: 2-4 weeks for simple usability improvements
- Medium-term: 1-3 months for site-wide or app-wide enhancements
- Strategic transformations: 3-12 months for comprehensive experience redesign
Most companies see measurable improvements in user engagement metrics within the first month of targeted UX enhancements.