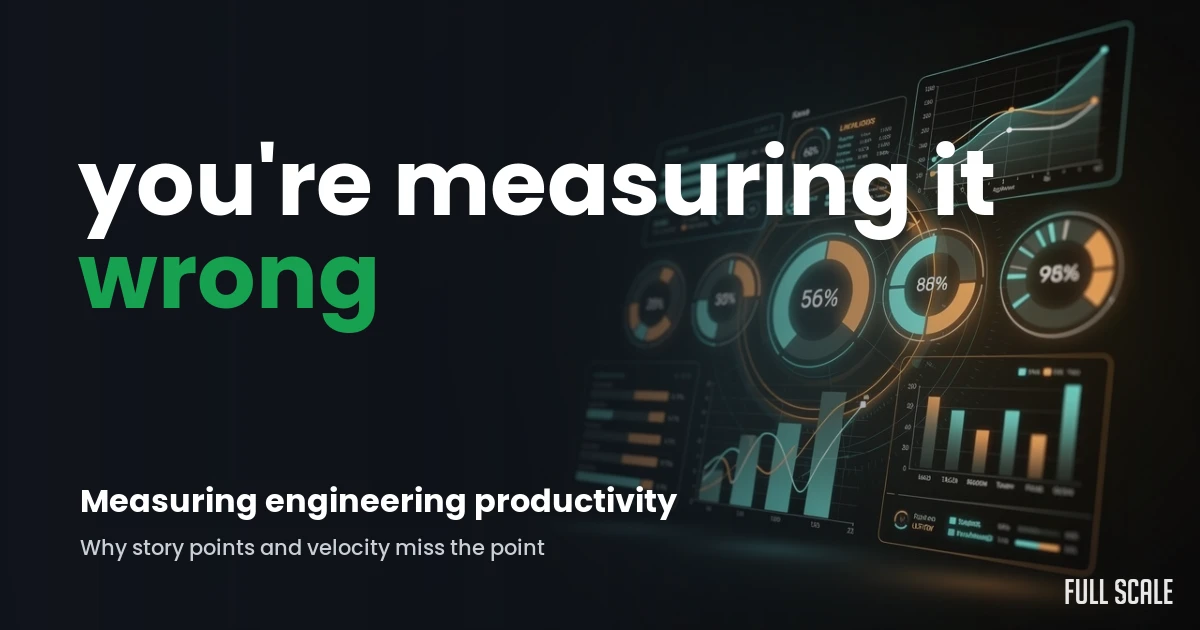
You’re Measuring Software Engineering Productivity Wrong
In this article
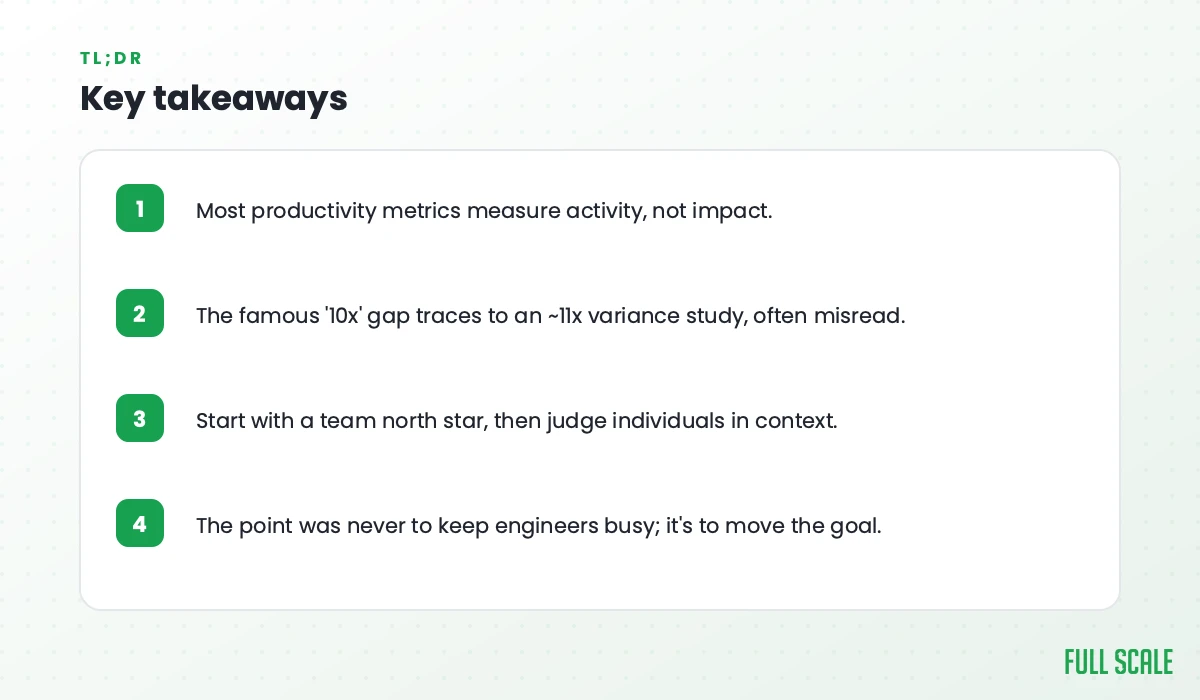
- Most software engineering productivity metrics measure activity, not value
- The whole industry already learned this the hard way
- Running an offshore team forced me to measure the right way
- What to measure instead: start with a north star
- Then how do you judge one person?
- How to roll this out without breaking trust
- Frequently asked questions
- The point was never to keep your engineers busy
Almost every popular way of measuring software engineering productivity is BS. Story points, lines of code, velocity, commits per day, time to merge: they all measure how busy your team looks, not whether any of the work actually mattered to a customer. The same trap shows up in team capacity planning, where a full sprint board gets mistaken for real delivery. Real delivery is code in production that works, which is the case for why use feature flags to ship in small, reversible increments.
And here’s the thing every engineering leader learns the hard way: whatever you measure, you get more of. So ask what your customers actually want. Do they want more story points, or more lines of code? Of course not. They want the product to solve their problem. Start measuring something that’s actually valuable to them.
I know all this because I ran engineering for years on exactly those vanity numbers. We hit our targets every sprint, we shipped constantly, and the dashboards stayed green. I told myself that meant the team was productive. Meanwhile the product wasn’t getting meaningfully better for the people paying us, and I couldn’t see it, because I was watching the wrong scoreboard.
It took me a long time, and eventually a team scattered across the planet, to figure out what to watch instead. You can hit every metric on the board and still ship nothing your customers needed.
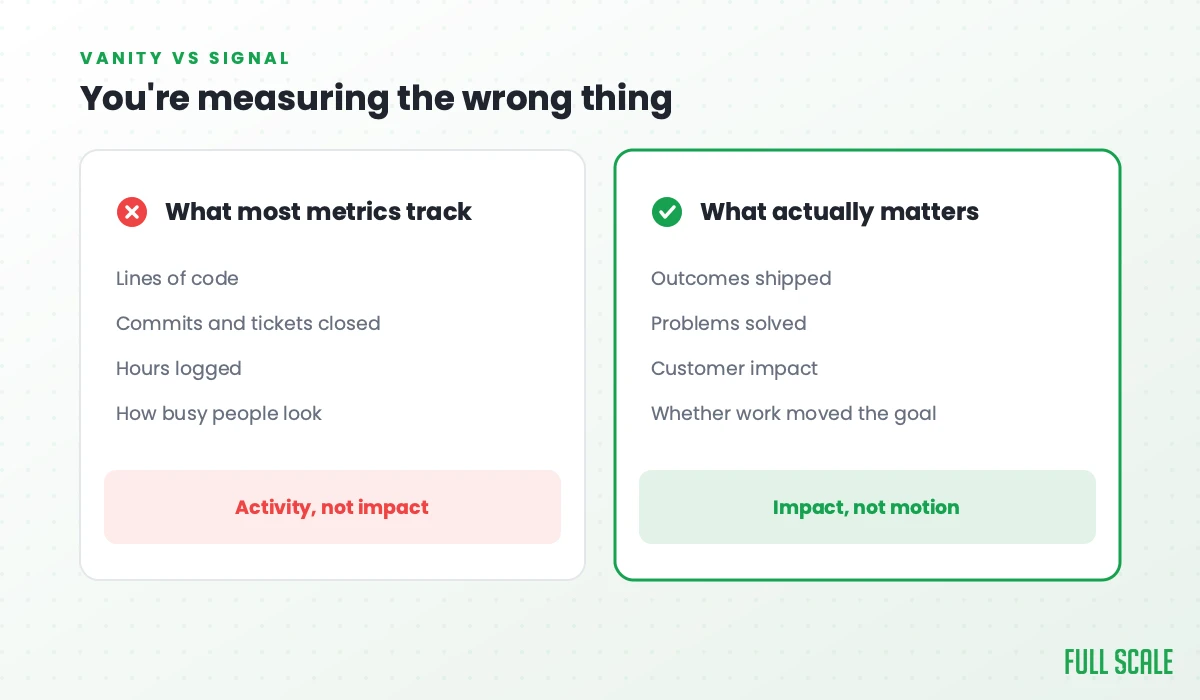
Most software engineering productivity metrics measure activity, not value
I’ve tried just about every developer productivity metric there is. Lines of code, commits, pull request counts, story points, velocity, defect rate, time to merge. Some of them are interesting. Most of them are easy to game, and the ones that aren’t easy to game still don’t apply to every developer or every kind of work.
Here’s the rundown of the usual suspects and how each one falls apart:
- Lines of code. Measures typing, not thinking. A strong engineer often solves a problem by writing less code, or deleting some.
- Commits and pull requests. Counts how often someone saves their work. Easy to inflate by chopping one change into ten.
- Story points and velocity. These are the team’s own guesses about its own work. Reward higher velocity and teams quietly inflate their estimates. You’ll see the number go up while nothing ships faster.
- Hours and seat time. Measures attendance. The person typing all day might be the one creating the mess everyone else cleans up later.
The real danger is in what these numbers quietly train your team to do. Measure lines of code and you’ll get more lines of code. You won’t get better software, you’ll get a bigger pile of technical debt to maintain.
AI has made this worse. When a coding assistant writes a big share of the code, lines and commits balloon, so the old activity counts climb while telling you even less about whether the work was any good. Google’s 2025 DORA report found AI now writes a large chunk of production code and that code churn is climbing right alongside it. More output, same question: did any of it matter? The deeper fix is rewarding outcomes over output, so a team is not measured only on how much it ships.
Story points were never meant to be a report card
Story points are a planning tool. They help a team talk about how big a piece of work feels before they start it. That’s useful. The trouble starts when a number invented to help a team plan gets promoted into a number used to judge the team. The estimate stops being honest the moment someone’s performance depends on it.
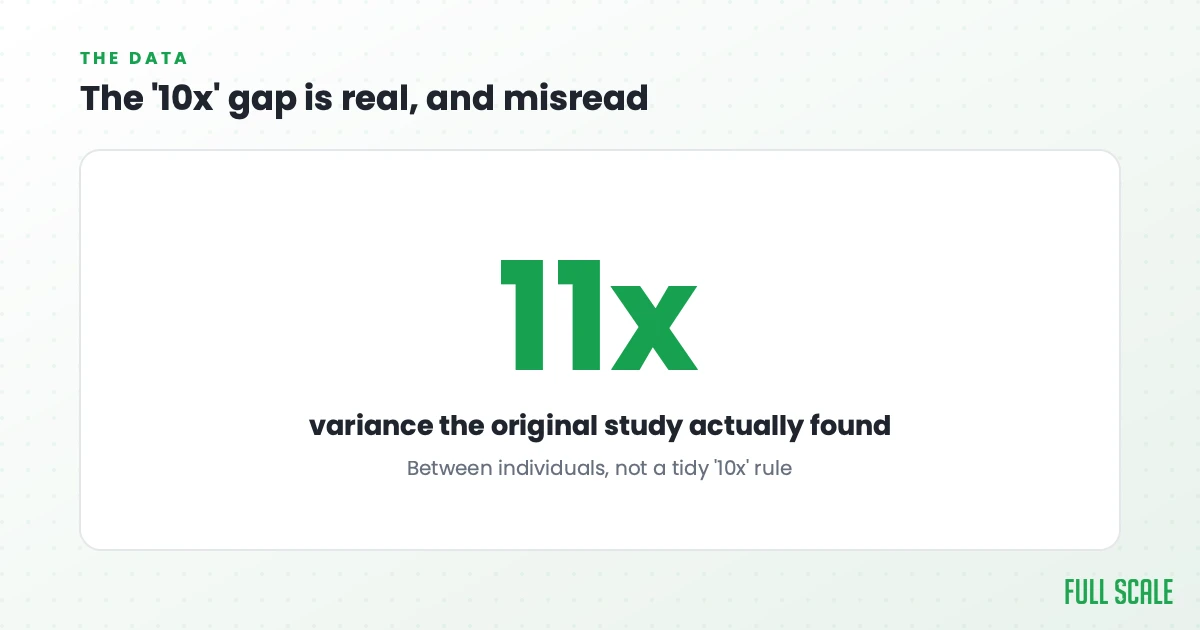
This is also why “10x developer” arguments tend to fall apart. On her episode of the Product Driven podcast, Laura Tacho, CTO of DX, pointed out that the famous “10x” gap actually traces back to a study showing roughly 11x variance between whole organizations, not between individuals. Inside a single team, the spread is much smaller. Most of the difference comes from the environment people work in, not some superhuman coder. If you’re grading individuals, you’re measuring the wrong unit.
The whole industry already learned this the hard way
If this sounds like a fringe opinion, it isn’t. The serious people in this field figured it out, and there was a very public fight about it.
In 2023, McKinsey published a framework for measuring developer productivity. The idea wasn’t crazy on its face: it tried to tie engineering effort to business outcomes and give leaders a way to spot where work was getting stuck. But the response from engineering leaders was brutal. Gergely Orosz and Kent Beck wrote a detailed takedown arguing the approach still measured activity and risked pushing teams toward exactly the behaviors that make software worse. Their point wasn’t that you can never measure anything. It was that measuring the wrong layer, then handing managers a tidy individual score, does real damage.
That’s the part worth holding onto. Good measurement frameworks exist. DORA, which came out of the Accelerate research by Nicole Forsgren and her team, and the SPACE framework are both genuinely useful. SPACE is the broader of the two: it looks at Satisfaction, Performance, Activity, Communication, and Efficiency, which means it bothers to ask how developers actually feel about their work, not just how much of it goes out the door. The frameworks themselves work. What breaks is how leaders use them, when a system-level signal gets turned into a stick to rank one engineer against another.
Running an offshore team forced me to measure the right way
Here’s where I got my own education, and it wasn’t by choice.
Over the years I’ve hired developers in Russia, Uruguay, Colombia, and the Philippines. When your team is on the other side of the planet, asleep while you’re awake, a lot of the comfortable old habits stop working. You can’t walk the floor and see who looks busy. You can’t reward the person who stays late, because you’re not there to see it. The packed standup where everyone sounds productive doesn’t happen on your clock.
So what’s left? The only thing you can actually see is what shipped and whether it moved the customer’s number.
When you can’t watch people work, you measure what their work produced, and that turns out to be the right way to manage everyone. Distance stripped away the theater and left me with the thing that always mattered underneath it. The rest of the industry, with its DORA dashboards and its arguments about McKinsey, is working its way toward what running a team across time zones taught me early.
It’s the honest answer to the question I get most at Full Scale from leaders weighing offshore software development or staff augmentation services: “How will I know they’re being productive if I can’t see them?” You’ll know the same way you should already know with your in-house team: by what they deliver, not by how busy they look.
Done isn’t when the code ships, it’s when the customer sees value
That line is the operating definition I wish someone had handed me twenty years ago. For a long time I didn’t run things that way. At Stackify I had a solid roadmap and we released constantly, and the product still didn’t land the way I expected. The reason was simple: we weren’t stopping to ask whether each thing we built mattered to the customer. We measured the shipping. We forgot to measure the point of shipping.
I wrote about this at length in my book, Product Driven. One of the quietest ways a team loses the plot is through what it chooses to measure. The more you measure output, the more your team optimizes for motion, and motion feels great right up until you notice nothing is improving for the people who pay you.
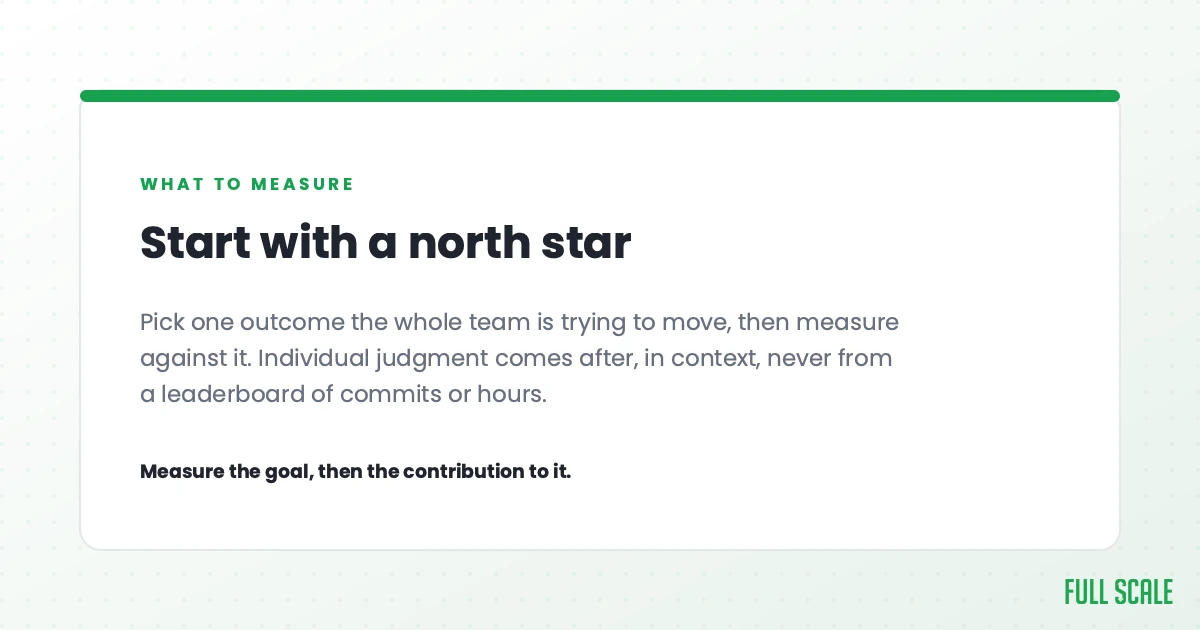
What to measure instead: start with a north star
So if lines of code and velocity are out, what goes in? I think about it as three layers, worst to best: raw activity, delivery health, and the customer outcome. The table below sorts the usual metrics into those layers.
| What you’re tempted to measure | What it actually tells you | Measure this instead |
|---|---|---|
| Lines of code, commits | How much was typed | Did working software ship |
| Story points, velocity | How the team estimates itself | Whether delivery is getting faster and safer |
| Hours, seat time | Who was present | Whether the customer’s number moved |
| Tickets closed | How much got processed | Whether the right problems got solved |
The bottom two layers, activity and delivery health, are means to an end. The top layer, the customer outcome, is the end. Most teams obsess over the first and never define the third.
Pick a north star metric built on the customer’s success
A north star metric is the one number that captures whether you’re creating real value for your customer, and it pulls product, engineering, support, and leadership into the same direction. The best companies already run on them. Spotify built its whole business around time spent listening rather than raw signups. Airbnb cares how many nights actually get booked. LinkedIn watches whether people engage with content rather than how many accounts exist.
The one I lived was VinSolutions. We sold software to car dealerships, and we didn’t grade our engineering team on features shipped or story points burned. We measured two things: how fast a dealership responded to its sales leads, and how many cars it sold. Every feature we built was judged against whether it moved those numbers. That was the whole job.
The most productive engineering team is the one whose work moves the number your customer actually cares about. Raw output doesn’t enter into it.
There’s a simple test from the book for finding yours. Ask the team: what does success look like for the user, and can we measure it? If you can’t answer that, no dashboard is going to save you.
Treat DORA metrics as the floor, not the goal
I don’t want to throw out delivery metrics. DORA’s four keys, deployment frequency, lead time for changes, change failure rate, and time to restore service, are a real upgrade over counting commits. They measure the health of your delivery system, and a team that deploys often and recovers fast is usually a team in good shape.
But be honest about what they are. Deployment frequency is still output. It tells you the machine is running smoothly. It says nothing about whether the machine is building the right thing. Use DORA as guardrails and as a way to spot when something’s going sideways. Don’t mistake a fast, reliable pipeline for a team that’s actually moving your customer’s number. And never turn the four keys into individual scorecards, because that’s the exact move that turns a good framework toxic.
A quality KPI I actually use: the deployment pullback ratio
Here’s a homegrown metric I like, because it ties speed back to whether the work held up. I call it the deployment pullback ratio: how much work you shipped in a release versus how much time you then spent fixing what that release broke.
The story that stuck this in my head came from an engineering leader I know well. He told me, “Every Monday we do a production release. On Tuesday we do two hotfixes, on Wednesday one, and if we’re lucky, none on Thursday.” That’s a normal week for a lot of teams. And it reframes the whole productivity question, because a release that needs three days of hotfixes wasn’t productive no matter what your velocity chart said. Tracking the pullback, alongside the defect escape rate, tells you something a line-of-code count never will: whether the work you shipped was actually done.
Then how do you judge one person?
This is the question every manager actually asks, and outcome metrics don’t answer it cleanly. A customer number can move for reasons that have nothing to do with one engineer, so you can’t run a performance review off it the way managers wish they could. Here’s how I do it instead, and none of it lives on a dashboard.
I talk to people every day about what they’re working on. If you always know what someone is working on, and whether they’re making progress or stuck, you can make a pretty good gut call on whether the amount of work feels right. That sounds soft. It isn’t. It’s the same judgment good managers have always used, and it holds up far better than a velocity chart that someone learned to game.
The second thing I watch is the questions people ask. An engineer who never asks anything worries me. It usually means they aren’t checking their assumptions or confirming they’re building the thing the right way, and that’s where the expensive mistakes hide. Good questions are a sign someone is engaged with the problem instead of just typing.
And in 2026 I’m asking everyone on the team the same thing constantly: how are you using AI to get more done? We’re all still figuring out the tooling, so I want every person using it, getting up to speed, and picking up new tricks. The engineer who shrugs at AI right now is the modern version of the one who never asks questions. That’s a developer productivity signal that matters more this year than any metric on a chart.
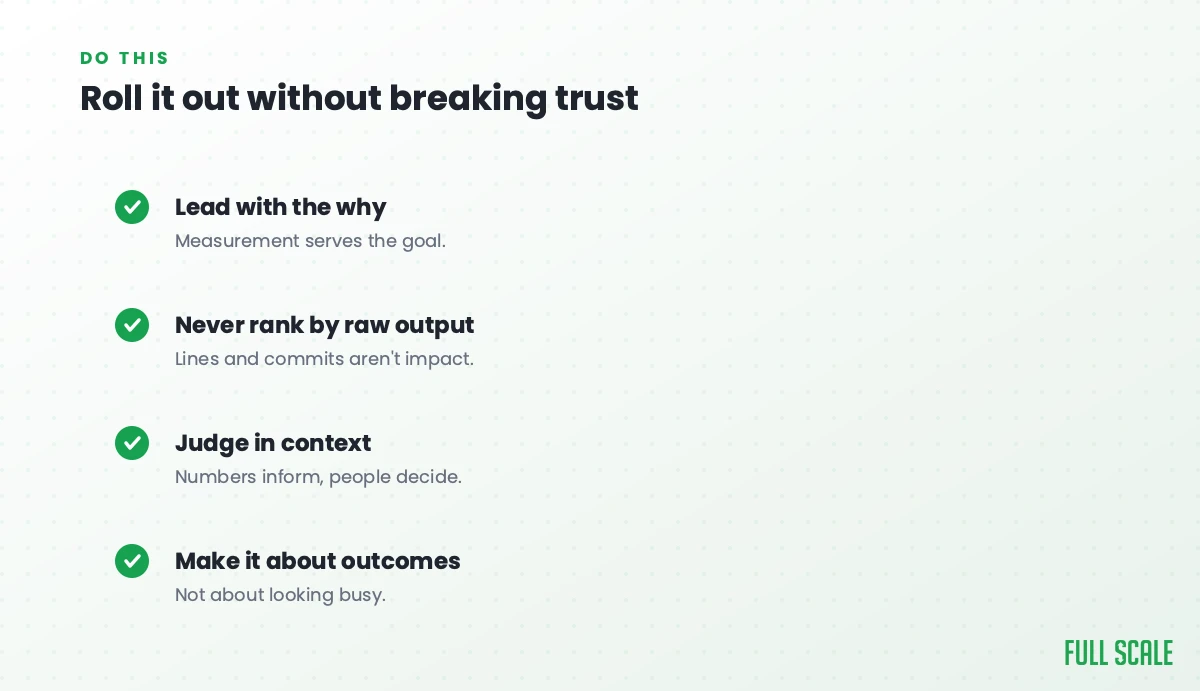
How to roll this out without breaking trust
Switching to outcome metrics is the right move, but it comes with real tradeoffs, and pretending otherwise will burn your team.
Outcome metrics are harder to game, which is the point. They’re also slower to read and harder to attribute to one person’s work, which is the cost. That’s exactly why the individual read has to come from conversation, not a number.
The bigger risk is using any of this as a weapon. On his Product Driven episode, Gleb Braverman, who founded HackerPulse after talking to hundreds of engineering leaders, made the point that most problems on engineering teams are people problems, not technical ones, and that metrics like DORA should inform how you lead rather than dictate it. That matches what Laura Tacho’s research at DX shows too: developers lose a big share of their week to organizational friction, the dumb stuff the rest of the company creates. Fix the system before you grade the person.
A short version of how to do this well:
- Measure delivery health and outcomes at the team and system level, never as an individual leaderboard.
- Define one north star tied to a customer result, and make sure everyone can name it.
- Use DORA and the pullback ratio as guardrails to catch problems early, never as a report card.
- Coach individuals in conversation, the way you always should, and pay attention to the questions they ask.
- Spend your energy removing friction, because that’s where most of the lost productivity actually hides.
If you want to go deeper, we’ve written separately about what software development metrics a CTO actually tracks, how to increase developer productivity, the tools that help you track delivery metrics without adding overhead, and the software engineering principles that still hold up when AI writes the code.
Frequently asked questions
What is the best way to measure software engineering productivity?
Measure outcomes and delivery health at the team level rather than individual activity. The strongest signal is whether working software shipped, held up in production, and moved a customer or business number. Frameworks like DORA and SPACE give you good system-level signals, but pair them with the actual result the work was meant to produce, because that customer outcome is the only thing that proves the work mattered.
Why are lines of code a bad productivity metric?
Lines of code measure typing, not value. A great engineer often solves a problem by writing less code or deleting some, so rewarding volume punishes exactly the right instinct. On top of that, any metric you reward gets gamed, so measuring lines of code mostly gets you more lines of code and the extra technical debt that comes with them. AI coding tools make this worse, because they inflate raw line and commit counts without telling you whether the work was any good.
Are DORA metrics enough to measure developer productivity?
DORA’s four keys, deployment frequency, lead time, change failure rate, and time to restore, are excellent measures of delivery health, but they describe your system, not a person, and they don’t tell you whether the right thing got built. Use them as guardrails alongside a customer-outcome metric, and never turn them into individual scorecards, because that pushes teams to optimize the dashboard instead of the product.
How do you measure the productivity of a remote or offshore engineering team?
You measure it the same way you should measure any team, except distance forces your hand. Since you can’t watch people work, you judge what their work produced and whether it held up. Define “done” as the customer seeing value, track delivery health and defects, talk to people daily about what they’re working on, and look at whether the outcome moved, rather than counting hours or watching who looks busy.
The point was never to keep your engineers busy
Busy is easy to fake, and most of our favorite metrics are very good at faking it. The point was never to keep your engineers busy. It was to ship the things your customers needed, and that’s the only productivity worth measuring.
If you’re trying to build an engineering team that’s measured on outcomes instead of activity, whether that’s your in-house group or a distributed team across time zones, let’s talk about what that looks like.