From Good to Great: How We Optimize Distributed Development Process Excellence
Your distributed team delivers on time, but you know they could be extraordinary. We’ve helped 60+ companies transform functional teams into competitive advantages. Here’s how to optimize distributed development process workflows for maximum impact.
According to GitLab’s 2021 Remote Work Report, high-performing distributed teams deliver 47% faster than average teams. McKinsey found that optimized distributed teams achieve 35% higher productivity than traditional co-located teams (2024). The difference isn’t talent—it’s process optimization.
This comprehensive guide reveals exactly how to elevate your distributed team from good to great. You’ll discover proven optimization frameworks, measurement strategies, and implementation roadmaps. By the end, you’ll have everything needed to transform your team’s performance.
What You'll Learn in This Guide
Audit Framework
10-minute performance assessment
7 Optimizations
Proven techniques for 3x productivity
KPIs That Matter
Track what drives real results
Real Case Study
3x productivity transformation
90-Day Roadmap
Step-by-step implementation plan
Common Pitfalls
Avoid costly mistakes
Expert Support
Partner with Full Scale
Reading Time: 15 minutes | Implementation Time: 90 days | Expected ROI: 3-5x
Armed with these insights, you’re ready to begin your optimization journey. Let’s explore what separates great distributed teams from merely good ones.
What Makes a Distributed Development Process “Great”?
Great distributed teams don’t happen by accident. They’re built through systematic optimization and continuous improvement. We measure excellence through five key performance indicators.
The Excellence Framework
Here’s what separates great distributed teams from good ones:
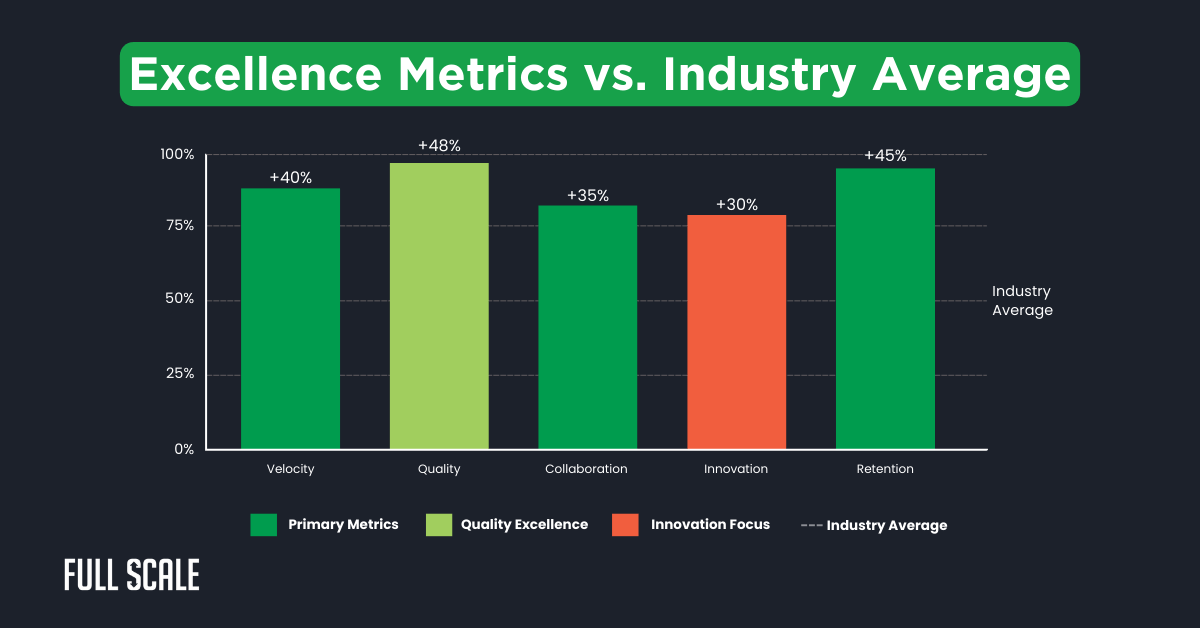
- Velocity: 40% faster feature delivery than the industry average
- Quality: Less than 2% defect escape rate across all releases
- Collaboration: Under 2-hour response time across any time zone
- Innovation: 30% of process improvements originate from distributed members
- Retention: Over 95% developer retention rate year-over-year
Understanding these metrics helps set clear optimization goals. The visual below shows how great teams consistently outperform industry averages. Each metric directly impacts your competitive position and bottom line.
With these excellence benchmarks established, you need to know where you currently stand. Let’s assess your team’s maturity level to create a targeted improvement plan.
The 5-Stage Distributed Development Maturity Model
Understanding your current position is half the battle won. Most teams think they’re further along than reality shows. Our maturity model cuts through self-deception with objective criteria.
Quick Assessment Tool
Identify where your distributed team currently operates:
Stage 1 – Chaotic: Ad-hoc processes, frequent emergencies, reactive management
Stage 2 – Functional: Basic processes work but remain inefficient and inconsistent
Stage 3 – Good: Predictable delivery with stable teams and defined workflows
Stage 4 – Optimized: Data-driven improvements with high efficiency metrics
Stage 5 – Great: Innovation engine creating competitive advantages daily
Use our interactive calculator to assess your team’s maturity level. Answer three simple questions about your current operations. The tool instantly reveals your stage and provides customized recommendations.
Distributed Team Maturity Calculator
Your Maturity Level:
Stage Description:
Recommended Next Steps:
Based on your responses, we estimate improvement potential with our optimization framework.
Now that you know your starting point, let’s dig deeper into performance gaps. The next step reveals exactly where your optimization efforts will yield the biggest returns.
Performance Audit: Identifying Your Optimization Opportunities
Here’s an uncomfortable truth: most teams operate at 40% of their potential. Before implementing changes, you need brutal honesty about current performance. Our 10-minute audit framework reveals hidden inefficiencies that silently kill productivity.
The 10-Minute Audit Framework
We’ve developed this framework after analyzing hundreds of distributed teams. It focuses on three critical performance areas that impact overall effectiveness. Spoiler alert: communication is usually the biggest disaster.
Communication Health Check
- Response time metrics across all time zones
- Meeting effectiveness score (productive vs. wasteful)
- Documentation accessibility index for remote team members
Development Velocity Metrics
- Cycle time breakdown by geographic location
- Handoff efficiency rate between time zones
- Deployment frequency and success rates
Quality Indicators
- Code review turnaround by reviewer location
- Bug origin analysis (which team introduced defects)
- Test coverage variations across distributed teams
The benchmark table below shows performance standards across key metrics. Compare your current metrics to identify immediate improvement opportunities. Focus first on areas showing the largest performance gaps.
Metric Category | Poor Performance | Good Performance | Great Performance |
Response Time | Over 24 hours | 4-8 hours | Under 2 hours |
Code Review | 3+ days | 1 day | 4 hours |
Deploy Frequency | Monthly | Weekly | Daily |
Documentation | Under 40% | 70% | Over 90% |
Ready to calculate your team’s optimization potential? According to a 2024 Stack Overflow survey, teams using structured optimization frameworks see 52% better performance metrics. Use our ROI calculator to estimate your potential gains.
Distributed Team ROI Calculator
Current Team Metrics
Projected Improvements
Time Savings
Delivery time: 0 days → 0 days
Cost Reduction
Annual savings through efficiency gains
Productivity Gains
Velocity: 0 → 0 points/sprint
Total Annual ROI
Payback period: 0 months
With audit results in hand, you’re ready for the fun part—transformation. The following optimizations have rescued teams from mediocrity and launched them to excellence.
7 High-Impact Optimizations We Use for Distributed Teams
After working with dozens of distributed development teams, we’ve battle-tested every optimization imaginable. These seven consistently deliver jaw-dropping results. Each technique addresses specific bottlenecks while improving overall team dynamics.
1. The Follow-the-Sun Development Model
Time zones are your secret weapon, not your enemy. Teams hand off work seamlessly, creating continuous 24-hour development cycles. While competitors sleep, your code keeps shipping.
Implementation Steps:
- Map team locations and overlap hours
- Create standardized handoff procedures
- Establish clear ownership boundaries
- Deploy automated status updates
Expected impact: 30% faster feature delivery with proper implementation.
2. Async-First Communication Protocol
Here’s a radical idea: ban meetings. We implement the 4-hour rule for all non-emergency communications. This protocol respects time zones while maintaining project momentum—and sanity.
Key Components:
- Written updates replace status meetings
- Video messages for complex explanations
- Structured documentation for all decisions
- Emergency escalation paths are clearly defined
Teams report 40% fewer meetings and higher satisfaction scores.
3. Distributed Pair Programming System
We often hear, “Pair programming across continents? You’re insane!” Then teams try it and become evangelists. Our refined techniques boost quality without burning out developers.
Time Zone Pairing Matrix:
- 2-hour overlap minimum for effective sessions
- Rotation schedule prevents burnout
- Recording sessions for async review
- Clear role definitions (driver/navigator)
Results show 25% fewer bugs reaching production.
4. Unified Development Environment
“Works on my machine” becomes extinct with cloud-based development environments. No more environment setup horror stories. Every developer gets identical, optimized setups in minutes, not days.
Implementation Strategy:
- Containerized development environments for all
- Cloud IDE adoption (Gitpod, GitHub Codespaces)
- Standardized toolchain across locations
- Automated environment provisioning
Onboarding time drops from 5 days to 1 day.
5. How We Optimize Distributed Development Process Through CI/CD
Continuous integration saves distributed teams from integration hell. Smart pipeline design prevents conflicts before they waste everyone’s time. Geographically built distribution turns global presence into pure advantage.
Optimization Techniques:
- Geographic build distribution
- Parallel test execution strategies
- Incremental build caching
- Automated rollback procedures
Deploy time improvements: 45 minutes down to 10 minutes.
6. Knowledge Mesh Architecture
Wiki graveyards litter the corporate landscape. Our knowledge mesh approach creates living documentation that teams actually use. Every team member contributes to and benefits from collective intelligence.
Core Components:
- Decentralized documentation ownership
- Expert mapping systems
- AI-powered search implementation
- Automatic knowledge gap detection
Information retrieval time reduces by 60%.
7. Performance Gaming System
Developers love games—use this to your advantage. Our gamification framework creates friendly competition without toxic pressure. Watch productivity soar as metrics become achievements rather than judgments.
Framework Elements:
- Team health scoreboards
- Velocity competitions with rewards
- Innovation challenges quarterly
- Peer recognition systems
Engagement scores increase 35% within three months.
These optimizations compound when implemented together. But how do you know they’re working?
Let’s explore measurement strategies that separate hope from reality.
Measuring Success: KPIs That Matter
“We’re doing great!” claims every team without data. Tracking the right metrics transforms gut feelings into actionable insights. We focus on KPIs that directly impact business outcomes, not vanity metrics that impress nobody.
The SMART Framework for Distributed Teams
Our measurement framework balances speed, quality, and collaboration metrics. Each KPI links directly to business value and team satisfaction. No fluffy metrics allowed—only hardcore performance indicators.
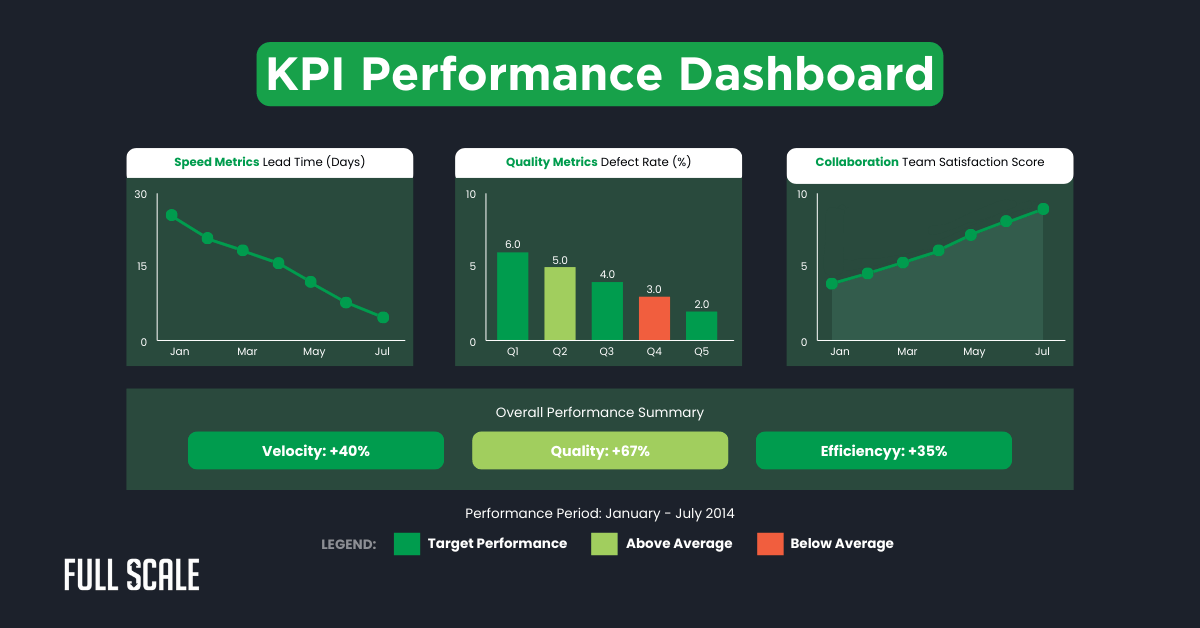
Speed Metrics
- Lead time for changes (idea to production)
- Deployment frequency per team
- Mean time to recovery from failures
Quality Metrics
- Change the failure rate by location
- Customer-reported defects per release
- Technical debt ratio trends
Collaboration Metrics
- Cross-location pull request reviews
- Knowledge sharing index scores
- Team satisfaction quarterly surveys
Real-time dashboards keep progress visible to all stakeholders. The visualization below shows a typical KPI dashboard for optimized teams. Notice how all metrics trend positively when optimizations work together.
Numbers tell stories, but real transformations inspire action. Let’s examine how one company achieved the impossible using these exact strategies.
Case Study: How a FinTech Achieved 3x Productivity
Enough theory—let’s talk results. The fintech’s transformation proves these aren’t just pretty frameworks. Their systematic approach to distributed agile development process optimization demonstrates what committed teams achieve.
The Transformation Journey
The fintech started where many teams find themselves—functional but frustrated. Their 15-person team across three continents delivered adequately. But “adequate” doesn’t win markets.
Starting Point:
- 15-person distributed team across the USA, Poland, Philippines
- 2-week sprints with frequent delays
- Quality issues are causing customer complaints
- Developer turnover at 30% annually
Interventions Applied:
- Implemented the follow-the-sun development model
- Introduced async-first communication protocols
- Deployed a unified cloud development environment
- Created a performance gaming system
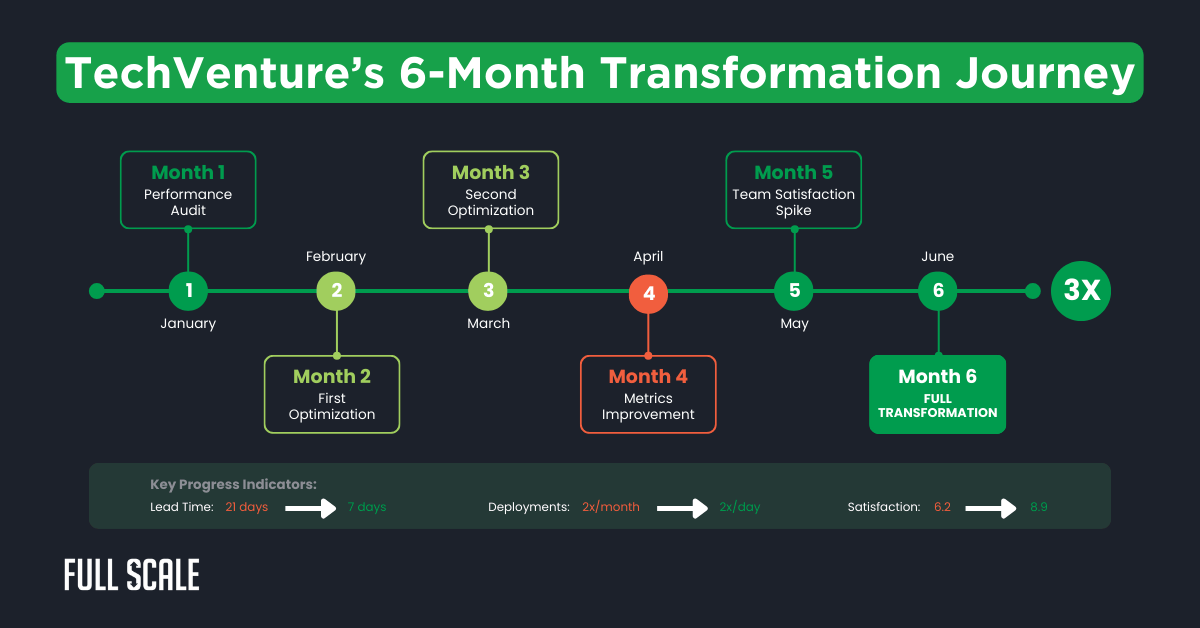
Results After 6 Months:
- Deployment frequency: 2x per month to 2x daily
- Lead time: 21 days reduced to 7 days
- Developer satisfaction: 6.2 increased to 8.9
- Customer complaints: 12 monthly down to 1
The timeline below illustrates their transformation journey month by month. Notice how each optimization builds upon previous improvements. This compound effect accelerates results over time.
The company’s success wasn’t luck—it was systematic execution. Your team can achieve similar results with the right roadmap. Let’s build yours.
Implementation Roadmap: Your Next 90 Days
Inspiration without action equals frustration. Our 90-day roadmap transforms wishful thinking into concrete results. Each phase builds momentum while delivering quick wins that keep teams engaged.
Days 1-30: Foundation Phase
No more analysis paralysis. This phase focuses on rapid assessment and strategic planning. Quick wins in week one create believers who champion larger changes.
Key Activities:
- Complete a comprehensive performance audit
- Identify the top 3 improvement opportunities
- Select the first 2 optimizations to implement
- Set up measurement dashboards
- Communicate vision to all team members
Days 31-60: Implementation Phase
Rubber meets road. This phase transforms plans into reality through systematic execution. Daily standups become progress celebrations, not status reports.
Focus Areas:
- Roll out the first optimization completely
- Begin second optimization deployment
- Conduct weekly progress reviews
- Gather continuous team feedback
- Adjust implementation based on data
Days 61-90: Optimization Phase
Victory lap time. Results emerge, and refinement accelerates progress. Success becomes self-reinforcing as teams see their metrics improve daily.
Critical Tasks:
- Analyze all performance metrics
- Document lessons learned
- Refine processes based on feedback
- Plan next optimization cycle
- Share success stories organization-wide
Perfect plans still fail without awareness of common traps. Let’s ensure you avoid the mistakes that derail 70% of optimization efforts.
Common Pitfalls and How to Avoid Them
Smart teams learn from others’ failures. We’ve witnessed these pitfalls destroy promising initiatives repeatedly. Consider this your vaccination against optimization diseases.
Tool Overload: Shiny new tools won’t fix broken processes. Start with process optimization, then add tools strategically. Technology amplifies good processes but can’t resurrect dead ones.
Change Fatigue: Rome wasn’t built in a day, and neither is excellence. Deploy one optimization at a time with adequate adjustment periods. Let teams master each change before introducing another.
Metric Fixation: Numbers matter, but aren’t everything. Balance quantitative metrics with qualitative team feedback regularly. Happy developers create better software than stressed ones—shocking, right?
Location Bias: Headquarters teams often receive preferential treatment unconsciously. Ensure equal investment in tools, training, and recognition across all locations. Remote team members need extra attention, not less.
Armed with knowledge and warned against pitfalls, you’re ready to transform your distributed team. But why struggle alone when expert help accelerates success?
Transform Your Distributed Team Today
You’ve seen what’s possible with systematic optimization. The gap between good and great isn’t talent—it’s process. Now it’s time to bridge that gap for your team.
At Full Scale, we don’t just talk about optimization—we live it. Our offshore development teams aren’t just cheaper alternatives—they’re high-performing distributed teams built on these exact optimization principles. We’ve mastered distributed development because that’s our entire business model.
How Full Scale Solves Your Distributed Team Challenges:
Our offshore development services directly address the optimization gaps you’ve identified. We’ve already implemented the follow-the-sun model, async-first protocols, and unified development environments across our 300+ developers. When you partner with us, you’re not starting from scratch—you’re plugging into an already-optimized system.
Why Full Scale’s Offshore Model Works:
- Pre-optimized teams: Our developers already use the 7 optimization techniques daily
- Proven distributed processes: 60+ clients benefit from our refined workflows
- Time zone advantage: Philippines-based teams create natural follow-the-sun development
- Direct integration: No middlemen—your offshore team works as an extension of your company
- Built-in metrics: Every team comes with KPI dashboards and performance tracking
The Full Scale Difference:
- Average client productivity increase of 40% within 6 months
- 95% developer retention rate (because we solved the offshore problem)
- Dedicated Client Success Managers who are optimization specialists
- Transparent and affordable pricing to experience the difference
- Month-to-month contracts—we earn your business daily
Your competitors are already leveraging optimized offshore teams to ship faster and cheaper. Every day without an optimized distributed team is lost velocity and wasted budget.
Let Full Scale’s proven offshore model accelerate your transformation.
Listen, transformation isn’t magic—it’s systematic execution. You’ll see initial improvements within 30 days, guaranteed. Full transformation takes 3-6 months of focused effort.
Got 5 developers? You’re good to go. These techniques scale beautifully from 5 to 500. Larger teams see bigger gains because there’s more chaos to eliminate.
Here’s the secret: make optimization part of your DNA. Monthly retrospectives and automated dashboards keep you honest. Success becomes self-sustaining when metrics are visible daily.
Resistance is just fear dressed up as logic. Start with volunteers who want improvement. Their success stories convert skeptics faster than any mandate ever could.
Sure, if you enjoy learning through expensive mistakes. Smart teams get expert guidance to avoid common pitfalls. Even a short consultation saves months of trial and error.
Simple math: track velocity gains, quality improvements, and retention rates. Calculate saved hours and prevented defects. Most teams see 3-5x ROI within year one—some much higher.