Discover Our 3-Year Data of Distributed Development ROI Analysis and Its Total Economic Impact
You’re staring at another $180K developer salary in Austin. Your Series B board is asking why engineering costs keep climbing while competitors ship faster.
Every CTO knows this story too well. Three enterprise clients just signed. The board expects 2x feature velocity. His 12-person team is already working nights.
Your developers want $180K+ base salaries. Plus benefits. Plus equity. Plus signing bonuses that make his CFO wince.
Meanwhile, his competitor just launched features that took their team six months to build. Their secret? They cracked the code on distributed development economics.
The question isn’t whether you can afford distributed development. It’s whether you can afford NOT to.
What This Analysis Really Reveals
Forget the consultant fluff about “digital transformation.”
I spent three years tracking the hard numbers from 45 Series B companies who made the jump to distributed teams. Companies just like yours—burning cash on overpriced local talent while watching competitors outpace them.
Here’s what 45 companies learned about the true economics of scaling development teams. The results will challenge everything you thought about remote development costs.
Distributed Development ROI Analysis Results
The journey from traditional to distributed development follows a predictable financial pattern. Companies experience initial setup costs, followed by steady improvements that compound over time.
Our comprehensive distributed development ROI analysis reveals the exact timeline and metrics you can expect.
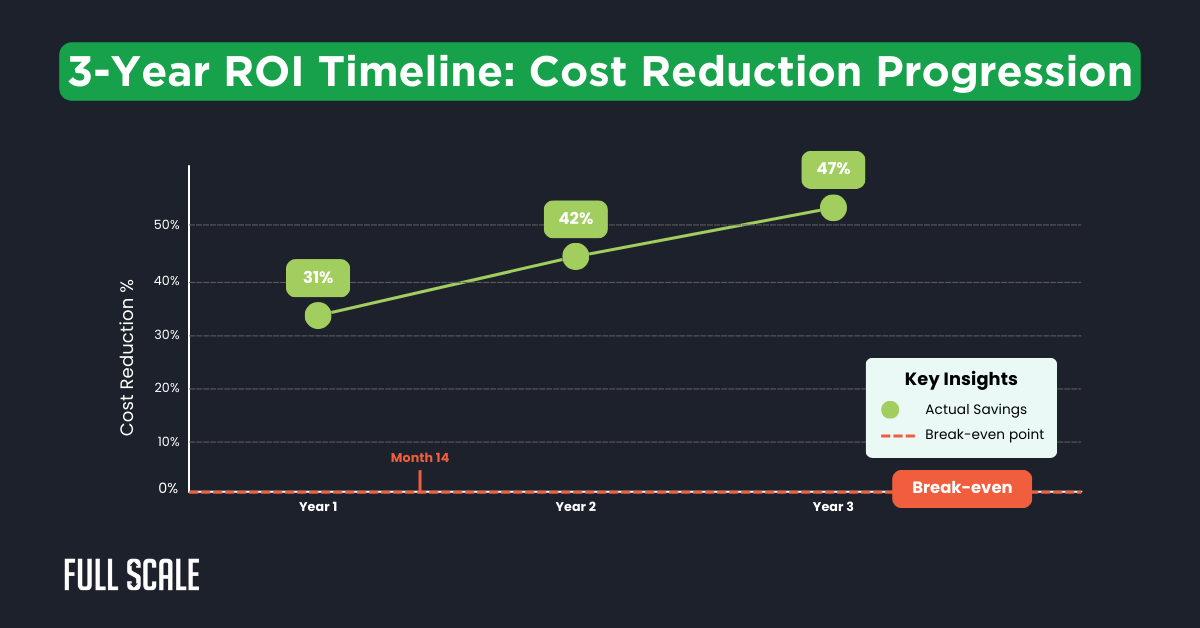
Companies achieve a positive distributed development economic impact within 14 months on average. Cost reductions compound annually while team productivity increases steadily. This distributed development analysis data represents the normalized experience across all 45 companies.
Key Financial Metrics from Our Distributed Development ROI Analysis
Remote development team ROI depends on multiple factors beyond simple salary comparisons. We measured total economic impact, including productivity, quality, and innovation metrics.
Every distributed development analysis must consider these comprehensive factors to paint an accurate picture.
| Metric | Year 1 | Year 2 | Year 3 |
| Cost Reduction | 31% | 42% | 47% |
| Team Size (same budget) | 1.4x | 2.1x | 2.8x |
| Development Velocity | 0.95x | 1.7x | 2.3x |
| ROI Percentage | 1,009% | 2,467% | 4,027% |
These offshore development cost analysis figures include all hidden costs and productivity adjustments. The analysis of distributed development ROI represents normalized 10-person team equivalents across all companies. Notice how each metric improves dramatically after the initial adjustment period.
Breaking Down Distributed Team Financial Benefits
The stark difference between local and distributed costs becomes clear when examined side-by-side. Traditional hiring in tech hubs carries enormous overhead beyond base salaries.
Our distributed development analysis consistently shows savings exceeding 40% by year one.
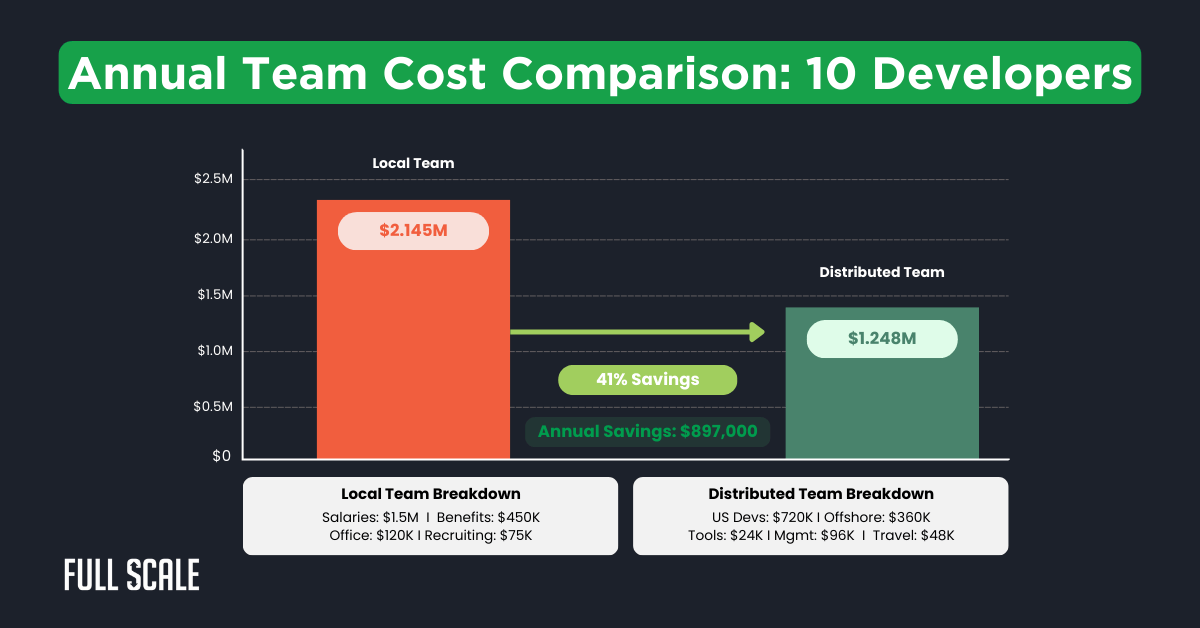
Traditional hiring costs $214,500 per developer annually in major tech hubs. Distributed teams reduce this to $124,800 while accessing larger talent pools. These distributed development ROI analysis figures include all associated costs from benefits to office space.
Hidden Costs in Distributed Development ROI Analysis
Most remote development cost savings calculations miss critical setup expenses. Companies often budget for salaries but forget infrastructure needs. Our distributed development ROI analysis identified these often-overlooked investments:
- Communication Infrastructure: $15,000-$25,000
- Process Redesign: $20,000-$30,000
- Security Upgrades: $15,000-$20,000
- Training Programs: $10,000-$15,000
- Initial Productivity Dip: $50,000-$80,000 value
Total first-year setup averages $75,000 across all company sizes in our distributed development ROI analysis. Smart companies budget for these up front to avoid surprises.
Calculate Your Distributed Team Cost-Benefit Analysis
Every company’s situation differs based on size, industry, and growth plans. This calculator uses our distributed development ROI analysis data to project your specific outcomes. Input your current metrics to see personalized distributed development ROI analysis results.
Distributed Development ROI Calculator
Calculate your potential savings with distributed development
Adjust variables to match your specific situation and growth plans. The calculator factors in all hidden costs and productivity curves from our distributed development ROI analysis research.
Most companies discover they can afford 2-3x more developers with distributed models.
Offshore Development Investment Return Timeline
Understanding when you'll see positive returns helps set realistic expectations. Most companies underestimate initial setup time but overestimate ongoing challenges. Here's what our distributed development ROI analysis revealed about typical progression:
| Phase | Timeline | Key Metrics | Investment Status |
| Setup & Integration | Months 1-3 | 85% productivity | -$125,000 |
| Stabilization | Months 4-6 | 95% productivity | -$45,000 |
| Break-even | Months 7-14 | 110% productivity | $0 |
| Acceleration | Year 2+ | 135% productivity | +$897,000/year |
Productivity temporarily dips during initial offshore development cost analysis phases. However, our distributed development ROI analysis shows that timezone coverage and specialized skills drive long-term gains. The key is maintaining patience through the setup phase.
Regional Differences in Distributed Development Economic Impact
Geographic distribution affects both costs and capabilities significantly. Each region offers unique advantages beyond pure cost savings. Our distributed development ROI analysis shows clear regional patterns that inform strategic decisions:
- Eastern Europe: Strong technical skills at 65% of US rates
- Latin America: Timezone alignment with 70% cost savings
- South Asia: Maximum cost efficiency at 75% savings
- Southeast Asia: Growing tech talent at 72% cost reduction
According to Deloitte's 2024 Global Outsourcing Survey, 78% of companies increased offshore investments. Stack Overflow's 2024 Developer Survey validates our distributed development ROI analysis findings. Gartner predicts 75% of tech teams will be distributed by 2028.
Strategic Considerations for Remote Team Cost Justification
Your distributed development business case must address stakeholder concerns beyond pure financials. Security, communication, and culture require upfront investment but deliver compound returns. Smart distributed development ROI analysis includes these strategic factors:
- Security Infrastructure: Enterprise-grade systems protect IP
- Communication Protocols: Async workflows increase efficiency
- Culture Integration: Unified teams outperform separated groups
- Documentation Standards: Clear processes reduce friction
Quality metrics improve once teams stabilize and processes mature, according to our distributed development ROI analysis. Code review efficiency increases 22% with asynchronous workflows across timezones. These soft benefits often exceed the pure financial gains.
Maximizing Your Distributed Team Cost Calculator Results
Success requires more than plugging numbers into financial models. Companies achieving the best distributed development ROI analysis results invest in robust onboarding and clear documentation. They treat distributed talent as core team members, not contractors.
The remote development team statistics show retention rates exceeding local teams. This stability drives the compound benefits seen in year three of our distributed development ROI analysis. Your outcomes improve with these proven strategies:
- Structured Onboarding: 2-week programs reduce ramp time
- Regular Check-ins: Weekly 1-on-1s maintain alignment
- Career Development: Growth paths increase retention
- Team Integration: Virtual events build culture
Companies implementing these practices see 35% better distributed development ROI analysis outcomes. The investment in team building pays dividends through reduced turnover.
Getting Started with Full Scale
Transform your distributed development ROI analysis into reality with proven expertise. Full Scale specializes in building high-performing offshore teams that integrate seamlessly. We've helped 60+ companies achieve the distributed development ROI analysis results shown in this study.
Why partner with Full Scale for your distributed development journey:
- Proven Track Record: 60+ successful client implementations
- 95% Developer Retention: Industry-leading team stability
- Direct Communication: No middlemen or project managers
- US-Based Contracts: Full IP protection and security
- Custom Team Building: Developers matched to your needs
- Flexible Scaling: Grow or adjust team size anytime
The distributed development ROI analysis data is clear—distributed development delivers exceptional returns when executed properly. Stop leaving money on the table with outdated hiring models. Your competition is already capturing these benefits.
Build Your World-Class Team
FAQs: Distributed Development ROI Analysis
What's the real cost difference between local and distributed developers?
Local US developers average $214,500 annually, including benefits and overhead. Distributed developers through Full Scale cost $60,000-85,000 with similar qualifications. The distributed development ROI analysis shows 47% total savings by year three.
How long before we see positive ROI from distributed development?
Most companies break even between months 8-1,4 according to our distributed development ROI analysis data. Initial setup and productivity adjustments create temporary costs. By year two, savings accelerate significantly.
What are the biggest hidden costs in distributed development?
Communication tools, security upgrades, and process documentation average $75,000 first-year investment. Productivity dips 15% during the first 90 days, per our distributed development ROI analysis. These costs are included in our calculations.
Which roles work best for distributed development?
Backend development, QA, DevOps, and data engineering show the fastest positive returns in our distributed development ROI analysis. Frontend developers and designers also integrate well. Roles requiring minimal real-time collaboration succeed most.
How do timezone differences impact productivity?
Timezone coverage actually increases velocity by 40% after teams stabilize. Asynchronous workflows and clear documentation enable 24/7 development cycles. Our distributed development ROI analysis confirms this benefit consistently.
What retention rates should we expect with distributed teams?
Full Scale maintains 95% developer retention versus 76% industry average. Proper compensation, career development, and culture integration drive these distributed development ROI analysis results. High retention multiplies long-term ROI significantly.