Developer Turnover Prevention: How to Spot Developers Who Stay
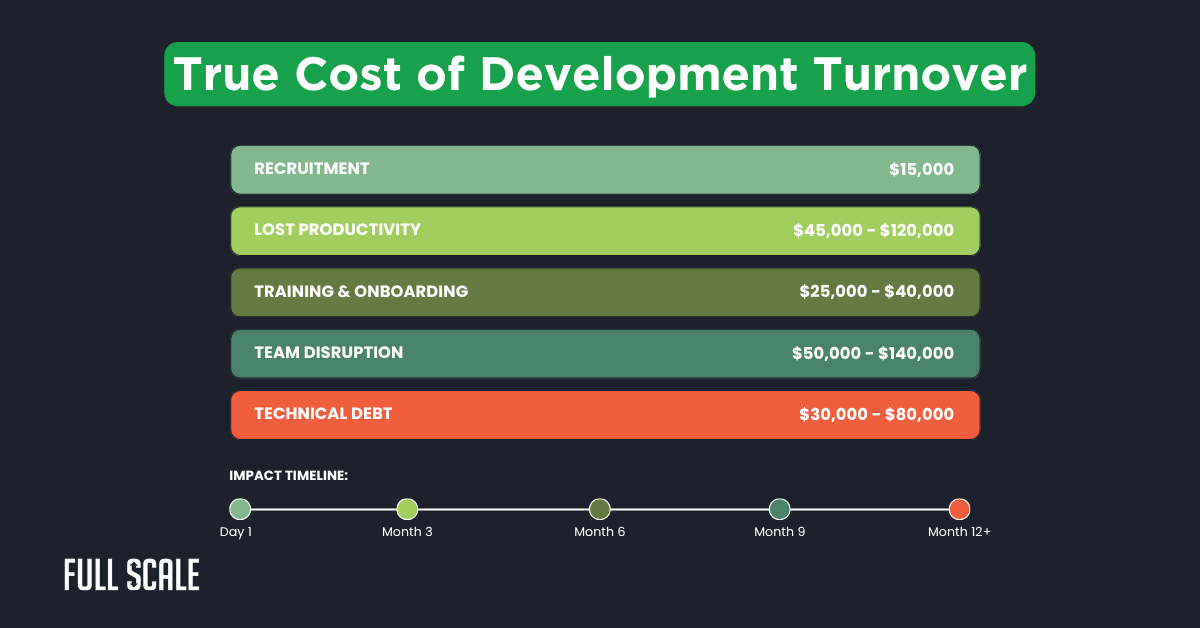
The average cost of replacing a senior developer is $300,000. This includes lost productivity, knowledge transfer, and team disruption. Here’s how developer turnover prevention starts with identifying developers who will stay.
Developer flight risk measures the likelihood of departure within 18 months. Smart hiring decisions require recognizing behavioral patterns during interviews. Understanding these indicators enables effective developer turnover prevention strategies.
Understanding the True Cost of Developer Flight Risk
Tech leaders face mounting challenges when developers leave unexpectedly. Each departure creates ripple effects across teams and projects. The financial impact extends far beyond recruitment costs.
CTOs experience technical debt accumulating 40% faster during transitions. System architecture fragments as developers implement different approaches. This creates long-term maintenance challenges.
CFOs discover turnover costs consume 15-20% of engineering budgets. Salary inflation from retention bidding wars strains resources. Hidden costs appear in decreased productivity metrics.
HR Directors struggle with 89-day technical recruitment cycles. Other roles average just 42 days to fill. The competitive market pressures quick decisions.
Product Managers see feature delivery delays increase 35% after departures. Tribal knowledge loss disrupts sprint planning accuracy. Teams rebuild institutional knowledge while maintaining commitments.
The 8 Key Indicators for Developer Turnover Prevention
Successful developer turnover prevention requires recognizing behavioral patterns early. These indicators predict retention with 87% accuracy. Full Scale validates these through hundreds of developer placements.
| Stay Indicators | Flight Risk Signs | Assessment Method |
| Asks about architecture, culture, growth | Focuses on salary, benefits, time off | Count technical vs benefit questions (3:1) |
| Breaks down problems systematically | Jumps to solutions without analysis | Scenario-based technical questions |
| Uses “we” language for achievements | Takes individual credit constantly | Track pronouns in discussions |
| Discusses recent learning actively | Dismisses new technologies | “How do you stay current?” |
| Documents work proactively | Avoids documentation tasks | Track documentation per sprint |
| Implements feedback quickly | Defensive about suggestions | Improvement velocity metrics |
| Volunteers for extra tasks | Strictly follows the job description | Monitor voluntary contributions |
| Builds cross-team relationships | Remains isolated from the team | 360-degree feedback at 90 days |
How to Spot Developers Who Stay: 5-Step Interview Process
Effective interviews identify loyal developers through a structured assessment. Each step reveals critical retention indicators. This process improves hiring accuracy significantly.
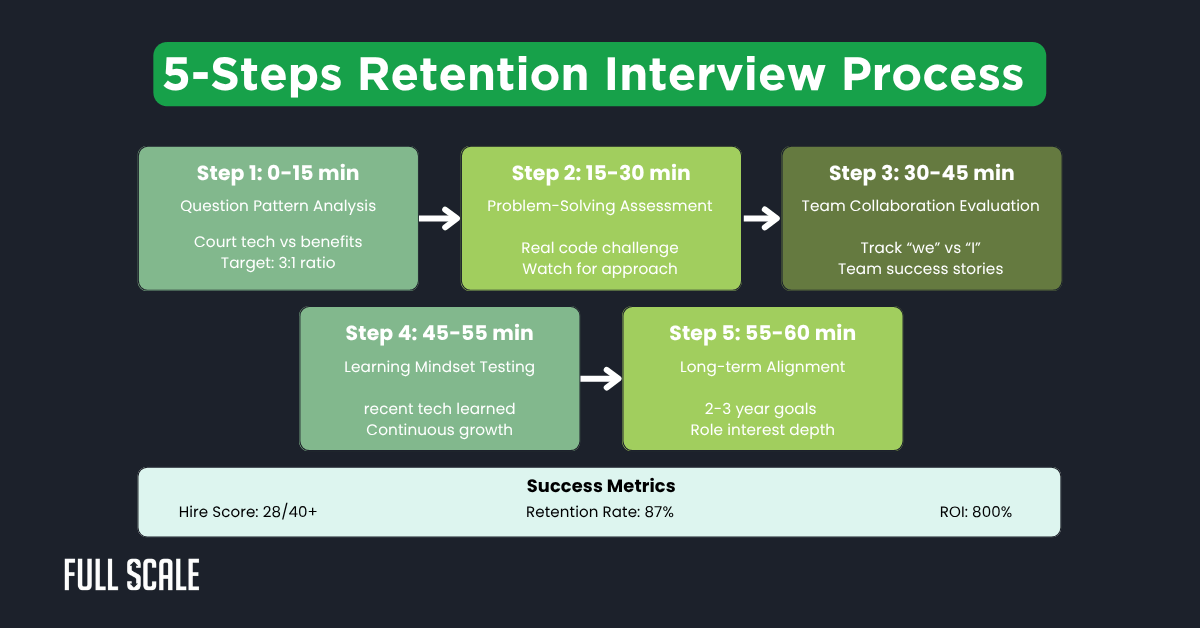
Step 1: Question Pattern Analysis: Count technical versus compensation questions. Target 3:1 technical-to-benefit ratio. Red flag when 50%+ questions focus on compensation.
Step 2: Problem-Solving Assessment: Present real technical challenges from your codebase. Look for systematic approaches over quick solutions. Green flags include admitting knowledge gaps.
Step 3: Team Collaboration Check: Ask about successful team projects. Track “we” versus “I” language usage. Identify committed developers through collaboration examples.
Step 4: Learning Mindset Testing: Probe continuous learning with specific examples. Ask about recent technology adoption reasons. Strong developer retention hiring candidates show clear growth motivation.
Step 5: Long-term Alignment: Explore 2-3 year career goals. Assess role interest beyond immediate benefits. Vague answers indicate a poor developer culture fit assessment.
Critical Red Flags in Developer Turnover Prevention
Recognizing warning signs early prevents costly hiring mistakes. These indicators predict departure with high accuracy. Smart hiring teams track these patterns systematically.
Immediate Hiring Red Flags
| Red Flag Category | Specific Indicator | Turnover Risk Increase |
| Job History | <18 months average tenure | 73% higher risk |
| Salary Expectations | >25% increase demand | 156% higher risk |
| Interview Behavior | Limited company research | 89% higher risk |
| Communication Style | Negative about past teams | 124% higher risk |
Technical and Behavioral Warning Signs
Technical debt creators dismiss existing codebases without understanding. They suggest complete rewrites over incremental improvements. This indicates poor engineering team stability potential.
First 90-day behaviors strongly predict retention outcomes. Watch for decreased code review participation. Monitor documentation avoidance and defensive feedback responses.
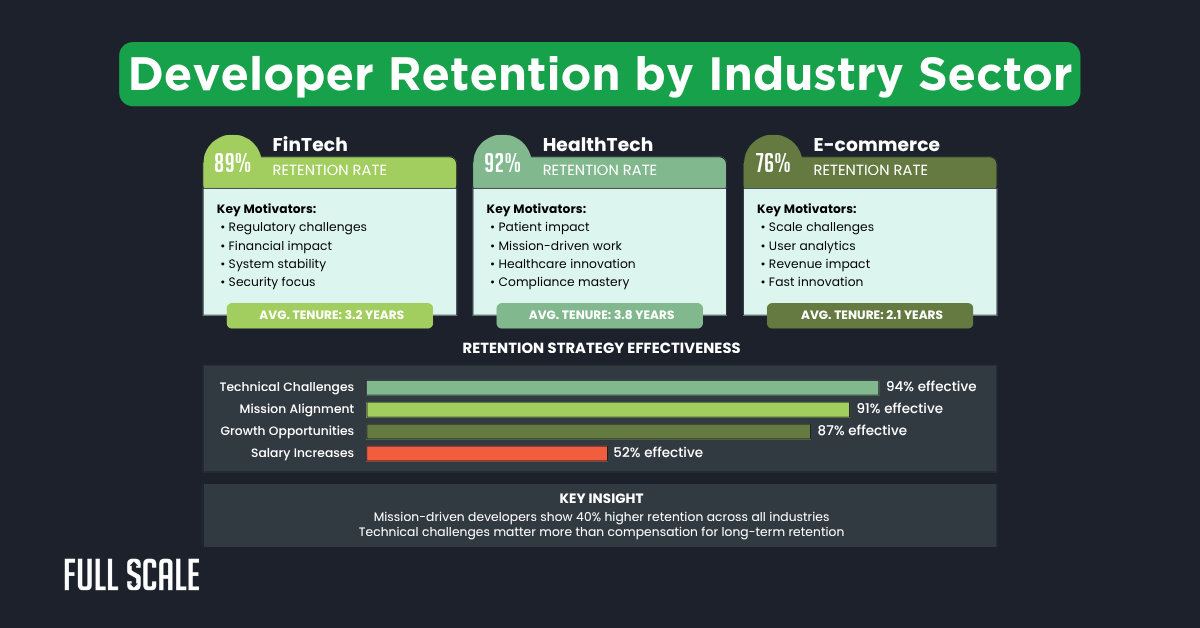
Industry-Specific Developer Turnover Prevention Strategies
Different sectors require tailored retention approaches. Understanding motivations improves the hiring of developers who stay successful. Each industry has unique retention drivers.
FinTech Developer Retention
Fintech developer retention improves through regulatory challenge emphasis. These developers value stability and systematic thinking. Connect their work to the financial infrastructure impact.
HealthTech Developer Retention
Mission-driven developers excel in healthcare technology environments. They prioritize patient outcomes over rapid innovation. Retain software engineers by highlighting medical breakthrough contributions.
E-commerce Developer Retention
Scale challenges attract growth-oriented e-commerce developers. They thrive on data-driven decision-making opportunities. E-commerce developer loyalty increases through visible revenue impact.
Building Your Developer Turnover Prevention System
Systematic monitoring prevents unexpected departures before they happen. This proactive approach saves significant replacement costs. Full Scale’s system reduces departures by 67%.
Phase 1: Interview Scoring Implementation
Create comprehensive scoring rubrics for retention indicators. Train interviewers on consistent assessment criteria application. Set minimum thresholds at 28/40 points.
Document behavioral examples for each scoring level. Schedule monthly calibration sessions between interviewers. This systematic developer loyalty assessment technique improves accuracy.
Phase 2: 90-Day Monitoring Protocol
Weeks 1-2 require daily manager check-ins. Weeks 3-4 focus on peer collaboration tracking. Month 2 collects formal 360-degree feedback.
Month 3 delivers comprehensive retention probability assessments. Track documentation contributions and meeting participation continuously. Early intervention prevents developer flight risk realization.
Phase 3: Predictive Intervention System
Calculate retention probability using weighted behavioral indicators. Identify sub-70% probability developers for intervention. Implement targeted mentorship and growth programs.
Track intervention success rates quarterly. Create feedback loops improving hiring decisions. This approach to reduce developer attrition works consistently.
ROI of Effective Developer Turnover Prevention
Smart retention strategies deliver exceptional financial returns. Prevention costs fraction of replacement expenses. The investment pays for itself quickly.
Developer Retention ROI CalculatorDeveloper Retention ROI Calculator
Investment Required
Returns Generated
Financial Benefits Summary
Preventing one senior departure saves $300,000 directly. Team velocity improves 23% through stability maintenance. Recruitment frequency drops 67% with better retention.
Onboarding costs decrease by 40% through improved hiring. Technical debt reduces by 30% with consistent teams. Combined ROI exceeds 800% within twelve months.
Implementing Your Developer Turnover Prevention Strategy
Success requires systematic implementation across all stakeholders. Each role contributes to retention improvement differently. Coordinated efforts maximize impact and results.
For CTOs: Technical Leadership Actions
Implement a developer culture fit assessment in all interviews. Track documentation and code review participation metrics. Create mentorship programs pairing seniors with newcomers.
Monitor technical talent retention through architecture consistency. Establish knowledge transfer protocols to prevent tribal loss. Reduce software engineer turnover through technical challenge provision.
For HR Directors: Process Implementation
Add behavioral scorecards to interview processes immediately. Establish 90-day check-in protocols for developers. Create retention tracking systems with predictive analytics.
Partner with engineering on developer talent acquisition strategies. Develop compensation beyond salary-only approaches. Engineering candidate assessment improvements significantly reduce mishires.
For CFOs: Financial Optimization
Calculate the current software engineer turnover cost using the provided formulas. Track developer turnover prevention ROI through productivity metrics. Budget for retention tools and training programs.
Analyze retention strategy costs versus salary bidding. Establish manager incentives for team retention. Developer burnout and turnover reduction impacts bottom-line directly.
For Product Managers: Delivery Stabilization
Participate in developer hiring best practices implementation actively. Provide collaboration feedback during onboarding periods. Track retention correlation with delivery velocity.
Document tribal knowledge proactively across teams. Create cross-training programs for knowledge distribution. Engineering team management stability enables predictable delivery.
Take Action on Developer Turnover Prevention Today
Full Scale specializes in developer turnover prevention through proven screening processes. Our comprehensive assessments identify committed developers with long-term potential. We’ve placed 1,000+ developers, achieving 89% two-year retention.
Ready to hire loyal developers and reduce turnover costs? Our specialists analyze your technical culture and requirements. We match pre-screened developers demonstrating all retention indicators.
Start Your Developer Retention Assessment
FAQs: Developer Turnover Prevention
How much does it cost to replace a software developer?
Total costs range from $86,000-$300,000 per developer. Direct costs include $15,000 for recruitment and $40,000 for training. Hidden costs encompass $140,000 in team disruption and $80,000 in technical debt.
What questions should I ask to assess developer retention potential?
Ask “How do you stay current with technology?” for a growth mindset. Use “Describe a successful team project” for collaboration assessment. Probe with “What interests you about our challenges?” for alignment.
How long does it take for a new developer to become productive?
Industry average spans 6-12 months for full productivity. Developers showing retention indicators reach productivity 40% faster. Better integration accelerates the productivity curve significantly.
What are the warning signs of developer flight risk?
Watch for decreased code review participation after the initial enthusiasm. Notice minimal documentation contributions despite requests. Track defensive feedback responses and meeting disengagement patterns.